Graduation Rates in Reasonable Completion Time
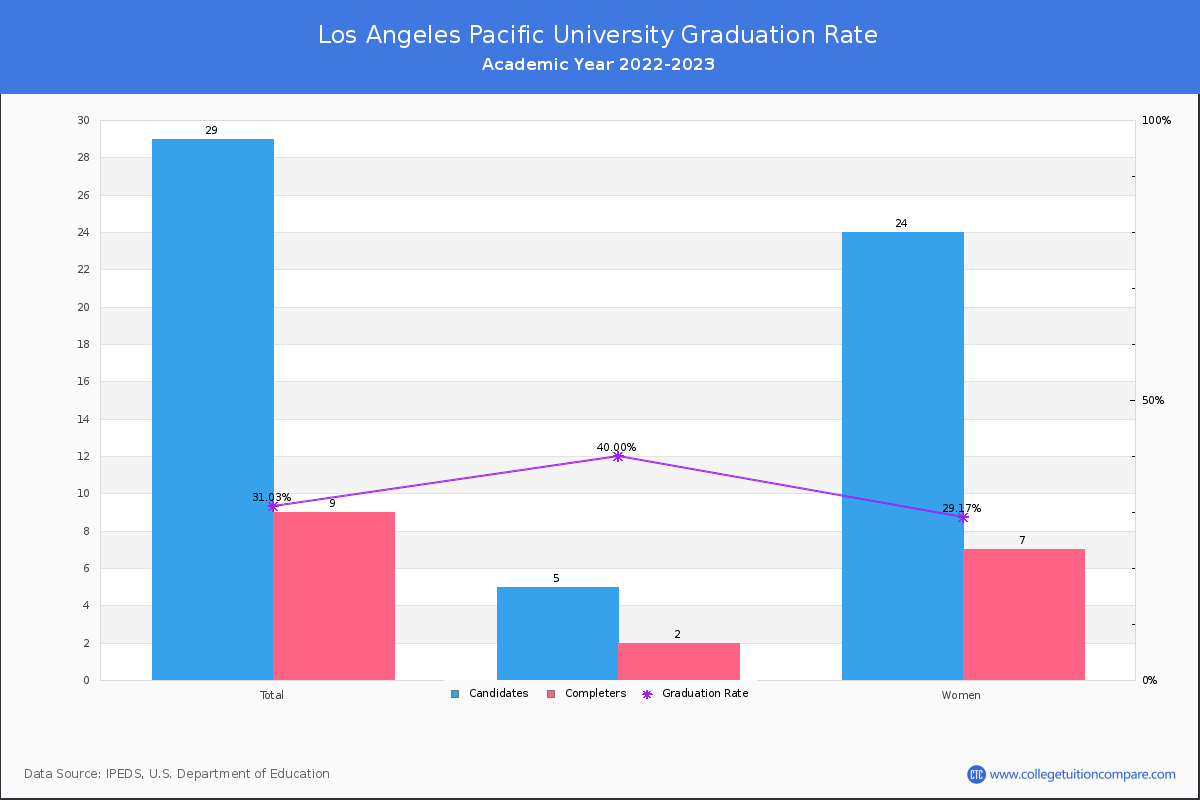
For the academic year 2022-2023, 9 students out of 29 candidates have completed their courses within 150% normal time (i.e. in 6 years for 4-year BS degree) at Los Angeles Pacific University.
By gender, 2 male and 7 female students graduated the school last year completing their jobs in the period. Its graduation rate is lower than the average rate when comparing similar colleges' rate of 55.50% (private (not-for-profit) Master's College and University with medium programs).
| Candidates | Completers | Graduation Rates | |
|---|---|---|---|
| Total | 29 | 9 | 31.03% |
| Men | 5 | 2 | 40.00% |
| Women | 24 | 7 | 29.17% |
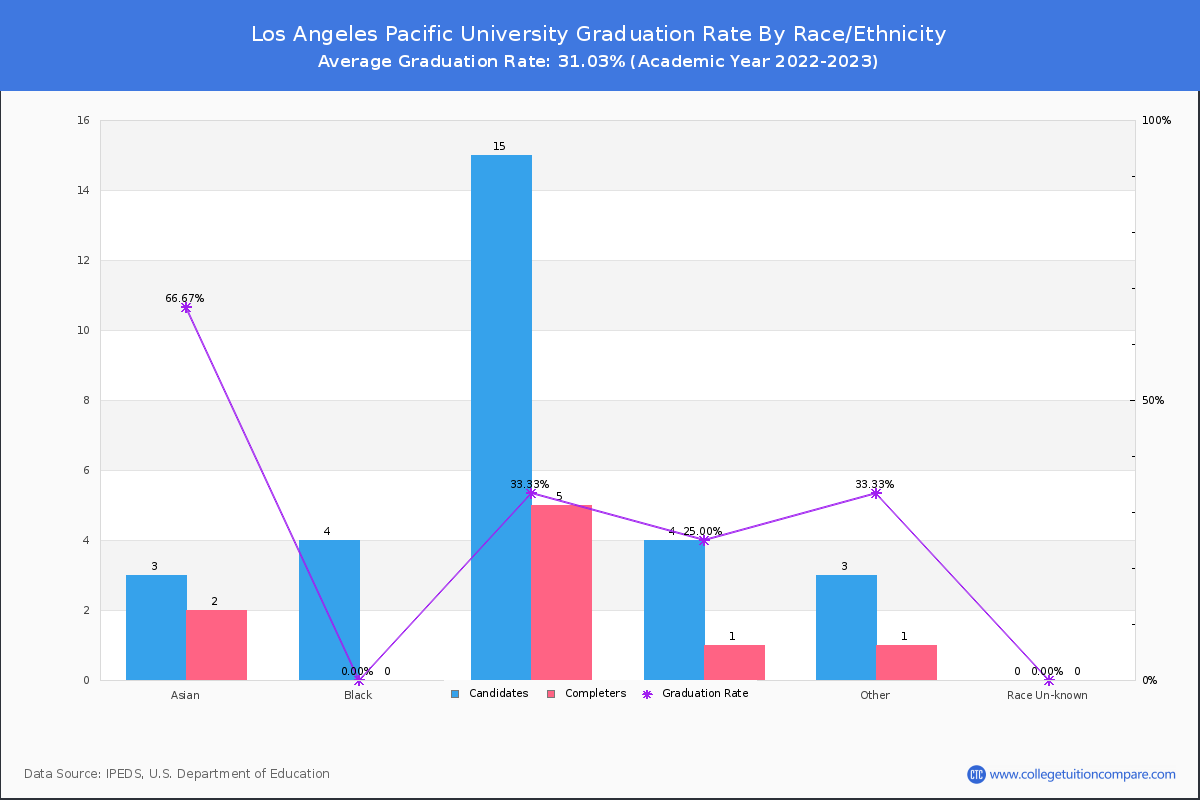
Graduation Rate By Race/Ethnicity
The following table shows graduation rate by race and at Los Angeles Pacific University.
- American Indian or Alaska Native: 0.00%
- Asian: 66.67%
- Black (Non-Hispanic): 0.00%
- Hispanic: 33.33%
- White: 25.00%
- Native Hawaiian or Other Pacific Islander: 0.00%
- Two or More Race: 100.00%
| Total | Male | Female | |
|---|---|---|---|
| American Indian or Alaska Native | 0.00%(-/1) | - | - |
| Asian | 66.67%(2/3) | - | 66.67%(2/3) |
| Black (Non-Hispanic) | 0.00%(-/4) | - | - |
| Hispanic | 33.33%(5/15) | 100.00%(1/1) | 28.57%(4/14) |
| White | 25.00%(1/4) | - | 25.00%(1/4) |
| Native Hawaiian or Other Pacific Islander | 0.00%(-/1) | - | - |
| Two or More Race | 100.00%(1/1) | 100.00%(1/1) | - |