Student Population by Gender
University of Antelope Valley has a total of 517 enrolled students for the academic year 2022-2023. 487 students have enrolled in undergraduate programs and 30 students joined graduate programs.
By gender, 236 male and 281 female students (the male-female ratio is 46:54) are attending the school. The gender distribution is based on the 2022-2023 data.
| Total | Undergraduate | Graduate | |
|---|---|---|---|
| Total | 517 | 487 | 30 |
| Men | 236 | 221 | 15 |
| Women | 281 | 266 | 15 |
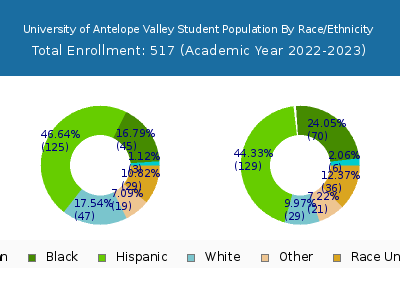
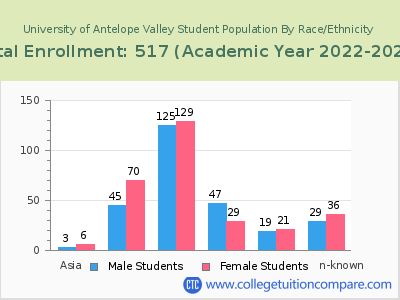
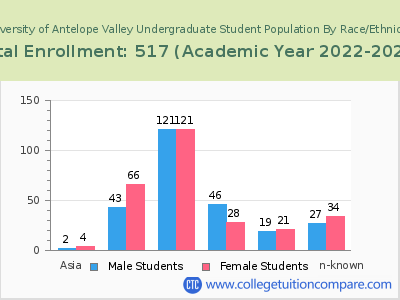
Student Distribution by Race/Ethnicity
| Race | Total | Men | Women |
|---|---|---|---|
| American Indian or Native American | 7 | 2 | 5 |
| Asian | 8 | 4 | 4 |
| Black | 91 | 34 | 57 |
| Hispanic | 246 | 105 | 141 |
| Native Hawaiian or Other Pacific Islanders | 6 | 2 | 4 |
| White | 67 | 41 | 26 |
| Two or more races | 34 | 14 | 20 |
| Race Unknown | 42 | 19 | 23 |
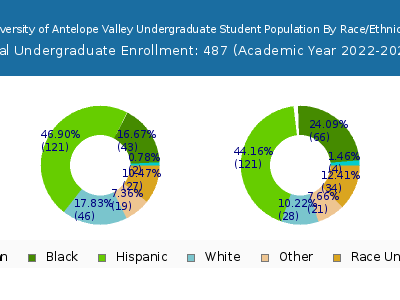
| Race | Total | Men | Women |
|---|---|---|---|
| American Indian or Native American | 7 | 2 | 5 |
| Asian | 8 | 4 | 4 |
| Black | 84 | 30 | 54 |
| Hispanic | 235 | 101 | 134 |
| Native Hawaiian or Other Pacific Islanders | 6 | 2 | 4 |
| White | 61 | 36 | 25 |
| Two or more races | 31 | 13 | 18 |
| Race Unknown | 39 | 18 | 21 |
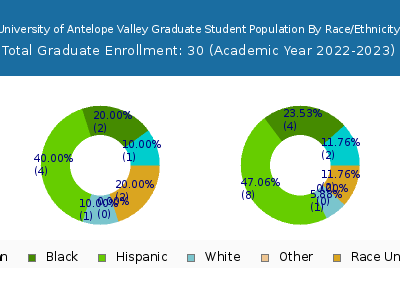
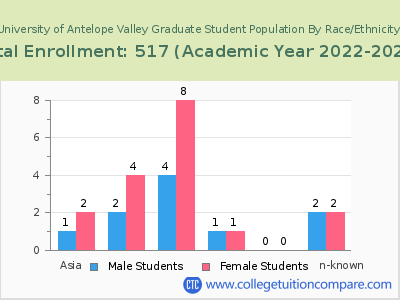
| Race | Total | Men | Women |
|---|---|---|---|
| American Indian or Native American | 1 | 0 | 1 |
| Asian | 3 | 3 | 0 |
| Black | 19 | 7 | 12 |
| Hispanic | 56 | 26 | 30 |
| Native Hawaiian or Other Pacific Islanders | 1 | 1 | 0 |
| White | 15 | 13 | 2 |
| Two or more races | 5 | 2 | 3 |
| Race Unknown | 5 | 3 | 2 |
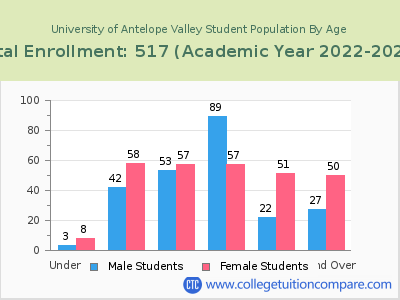
Student Age Distribution
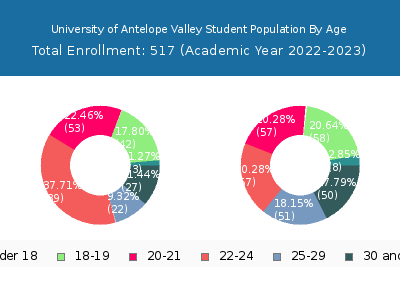
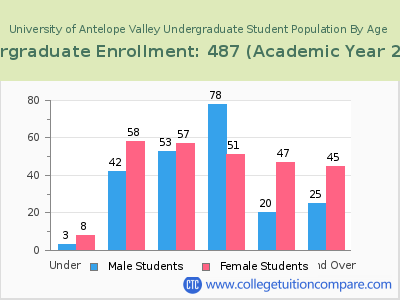
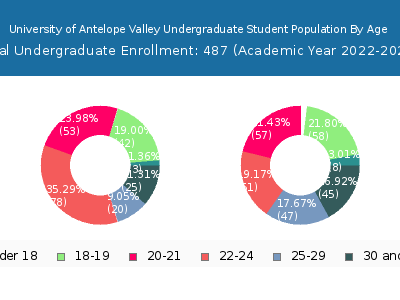
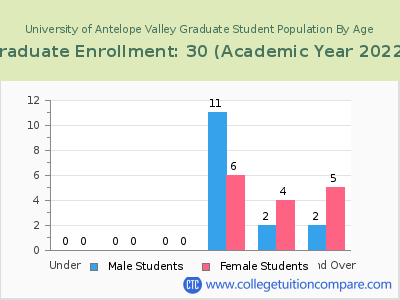
By age, UAV has 11 students under 18 years old and 1 students over 65 years old. There are 367 students under 25 years old, and 150 students over 25 years old out of 517 total students.
In undergraduate programs, 11 students are younger than 18 and 1 students are older than 65. UAV has 350 undergraduate students aged under 25 and 137 students aged 25 and over.
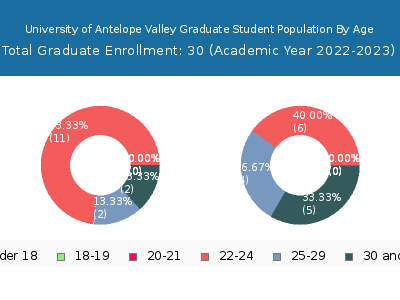
It has 17 graduate students aged under 25 and 13 students aged 25 and over.
| Age | Total | Men | Women |
|---|---|---|---|
| Under 18 | 11 | 8 | 3 |
| 18-19 | 100 | 58 | 42 |
| 20-21 | 110 | 57 | 53 |
| 22-24 | 146 | 57 | 89 |
| 25-29 | 73 | 51 | 22 |
| 30-34 | 38 | 25 | 13 |
| 35-39 | 14 | 7 | 7 |
| 40-49 | 21 | 14 | 7 |
| 50-64 | 3 | 3 | 0 |
| Over 65 | 1 | 1 | 0 |
| Age | Total | Men | Women |
|---|---|---|---|
| Under 18 | 11 | 8 | 3 |
| 18-19 | 100 | 58 | 42 |
| 20-21 | 110 | 57 | 53 |
| 22-24 | 129 | 51 | 78 |
| 25-29 | 67 | 47 | 20 |
| 30-34 | 34 | 22 | 12 |
| 35-39 | 14 | 7 | 7 |
| 40-49 | 18 | 12 | 6 |
| 50-64 | 3 | 3 | 0 |
| Over 65 | 1 | 1 | 0 |
| Age | Total | Men | Women |
|---|
Online Student Enrollment
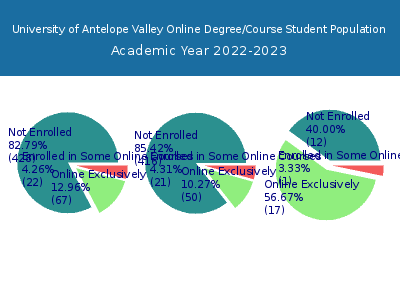
Distance learning, also called online education, is very attractive to students, especially who want to continue education and work in field. At University of Antelope Valley, 67 students are enrolled exclusively in online courses and 22 students are enrolled in some online courses.
64 students lived in California or jurisdiction in which the school is located are enrolled exclusively in online courses and 3 students live in other State or outside of the United States.
| All Students | Enrolled Exclusively Online Courses | Enrolled in Some Online Courses | |
|---|---|---|---|
| All Students | 517 | 67 | 22 |
| Undergraduate | 487 | 50 | 21 |
| Graduate | 30 | 17 | 1 |
| California Residents | Other States in U.S. | Outside of U.S. | |
|---|---|---|---|
| All Students | 64 | 3 | 0 |
| Undergraduate | 50 | - | 0 |
| Graduate | 14 | 3 | 0 |
Transfer-in Students (Undergraduate)
Among 487 enrolled in undergraduate programs, 109 students have transferred-in from other institutions. The percentage of transfer-in students is 22.38%.103 students have transferred in as full-time status and 6 students transferred in as part-time status.
| Number of Students | |
|---|---|
| Regular Full-time | 350 |
| Transfer-in Full-time | 103 |
| Regular Part-time | 28 |
| Transfer-in Part-time | 6 |
