Student Population by Gender
New Professions Technical Institute has a total of 279 enrolled students for the academic year 2022-2023. All 279 students are enrolled into undergraduate programs.
By gender, 42 male and 237 female students (the male-female ratio is 15:85) are attending the school. The gender distribution is based on the 2022-2023 data.
| Undergraduate | |
|---|---|
| Total | 279 |
| Men | 42 |
| Women | 237 |
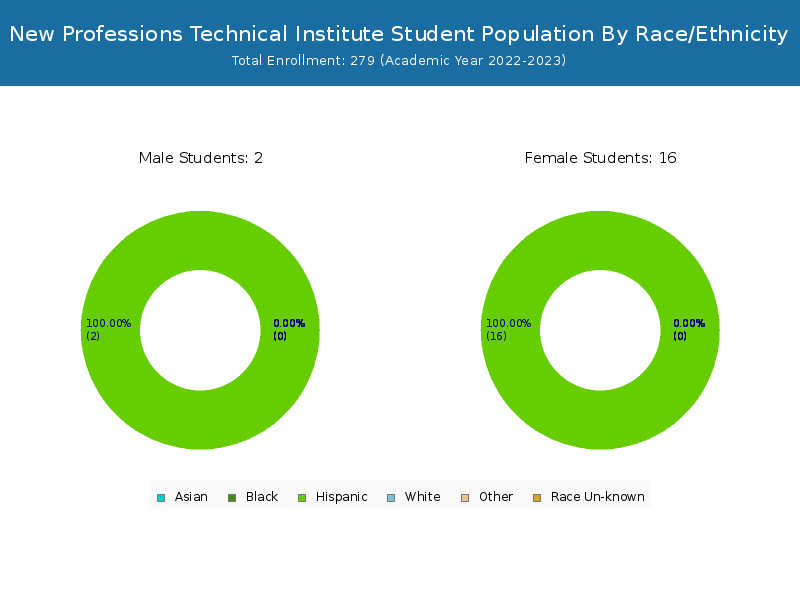
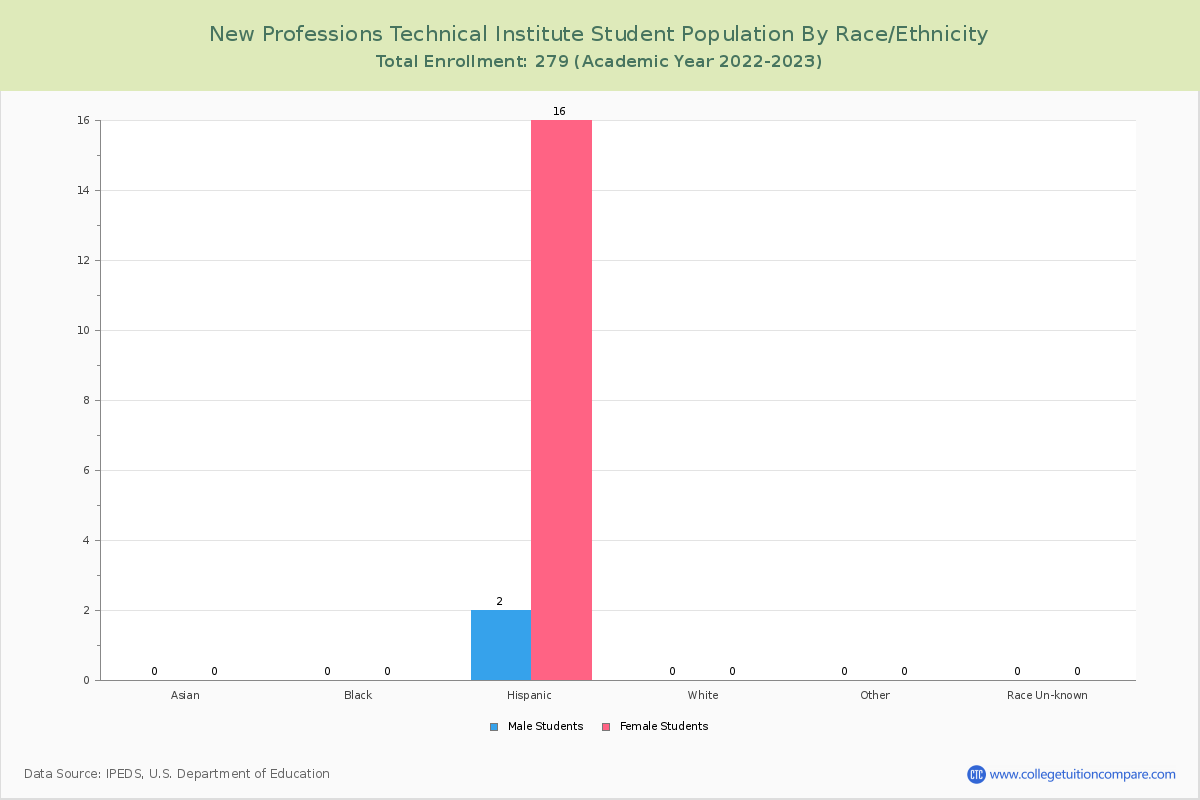
Student Distribution by Race/Ethnicity
By race/ethnicity, 0 White, and 19 Black students out of a total of 279 are attending at New Professions Technical Institute. Comprehensive enrollment statistic data by race/ethnicity is shown in the next chart (Academic year 2022-2023 data).
| Race | Total | Men | Women |
|---|---|---|---|
| American Indian or Native American | 0 | 0 | 0 |
| Asian | 0 | 0 | 0 |
| Black | 19 | 0 | 19 |
| Hispanic | 260 | 42 | 218 |
| Native Hawaiian or Other Pacific Islanders | 0 | 0 | 0 |
| White | 0 | 0 | 0 |
| Two or more races | 0 | 0 | 0 |
| Race Unknown | 0 | 0 | 0 |
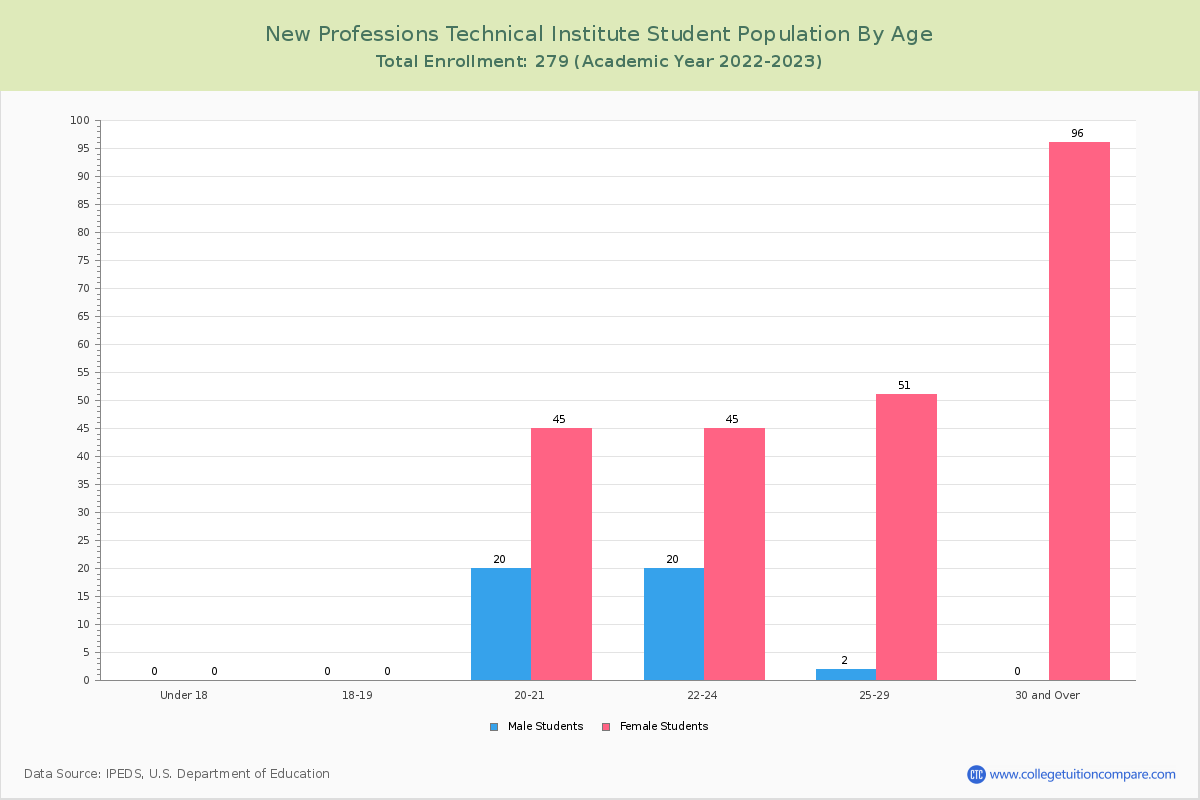
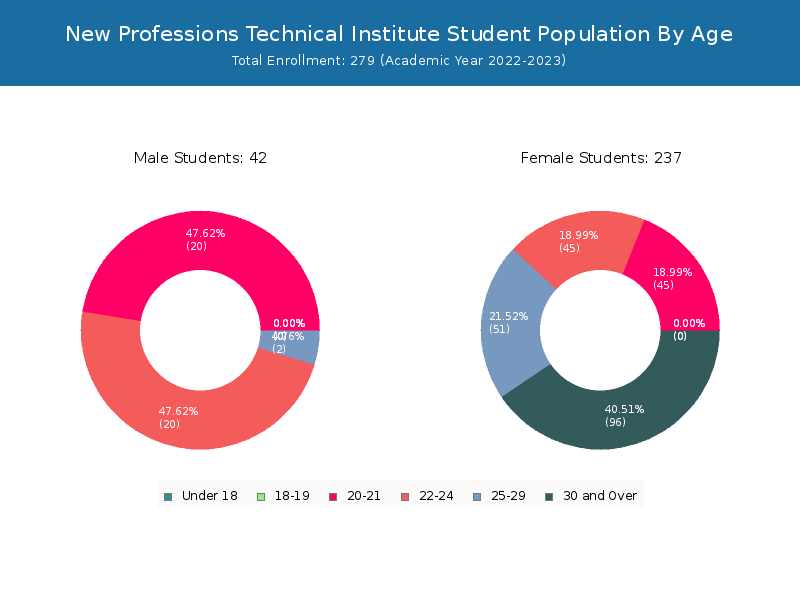
Student Age Distribution
There are 130 students under 25 years old, and 149 students over 25 years old out of 279 total students.
| Age | Total | Men | Women |
|---|
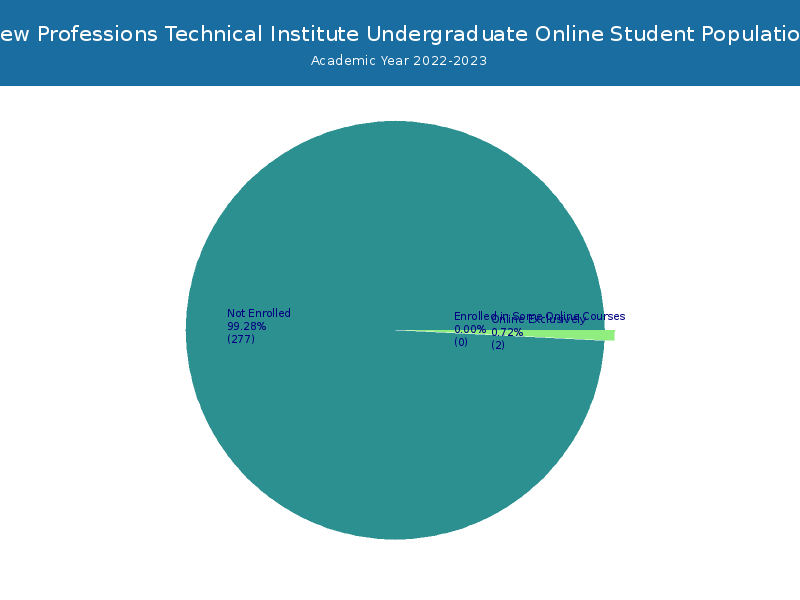
Online Student Enrollment
Distance learning, also called online education, is very attractive to students, especially who want to continue education and work in field. At New Professions Technical Institute, 2 students are enrolled exclusively in online courses and 0 students are enrolled in some online courses.
2 students lived in Florida or jurisdiction in which the school is located are enrolled exclusively in online courses and - students live in other State or outside of the United States.
| All Students | Enrolled Exclusively Online Courses | Enrolled in Some Online Courses | |
|---|---|---|---|
| All Students | 279 | 2 | 0 |
| Undergraduate | 279 | 2 | 0 |
| Florida Residents | Other States in U.S. | Outside of U.S. | |
|---|---|---|---|
| All Students | 2 | - | 0 |
| Undergraduate | 2 | - | 0 |
| Graduate | - | - | - |