Student Population by Gender
Purdue University-Main Campus has a total of 51,528 enrolled students for the academic year 2022-2023. 38,593 students have enrolled in undergraduate programs and 12,935 students joined graduate programs.
By gender, 29,790 male and 21,738 female students (the male-female ratio is 58:42) are attending the school. The gender distribution is based on the 2022-2023 data.
| Total | Undergraduate | Graduate | |
|---|---|---|---|
| Total | 51,528 | 38,593 | 12,935 |
| Men | 29,790 | 22,210 | 7,580 |
| Women | 21,738 | 16,383 | 5,355 |
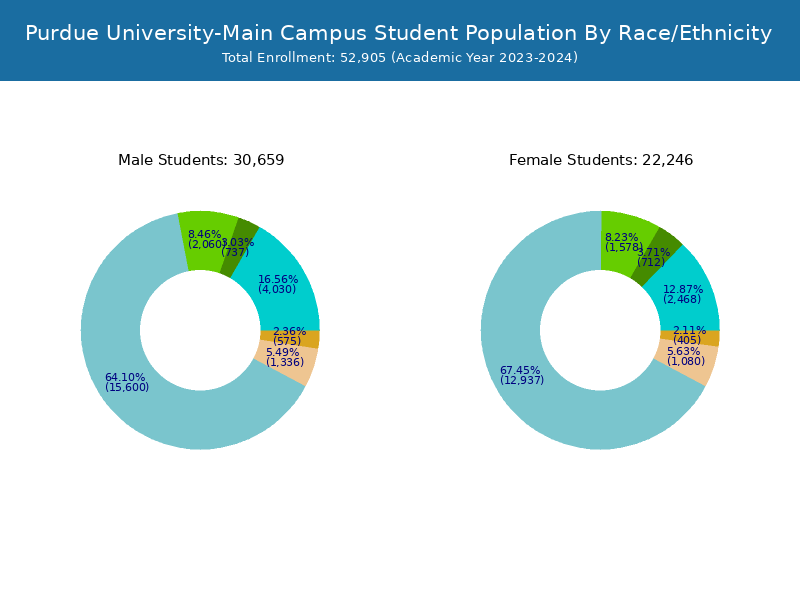
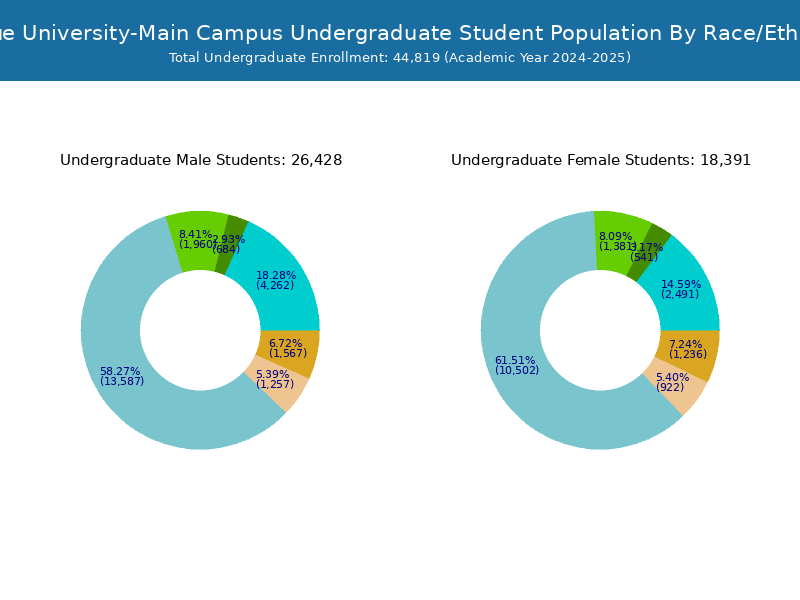
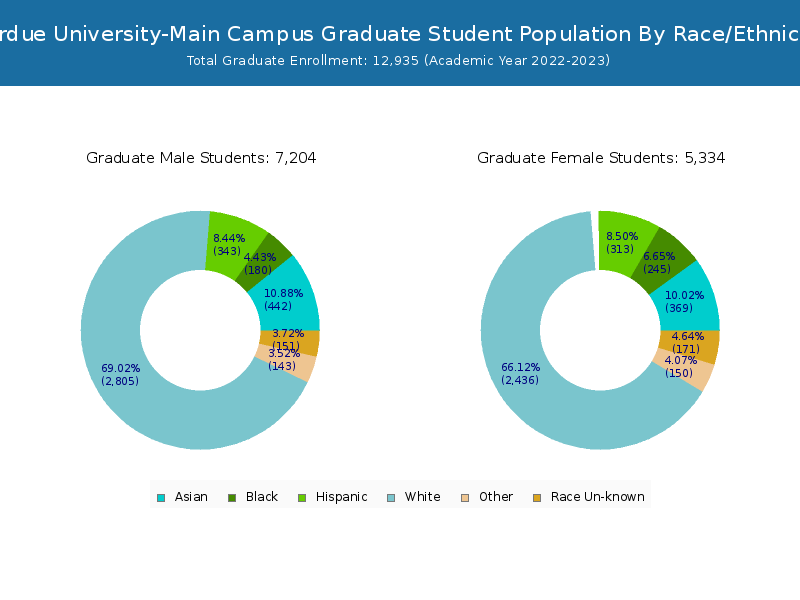
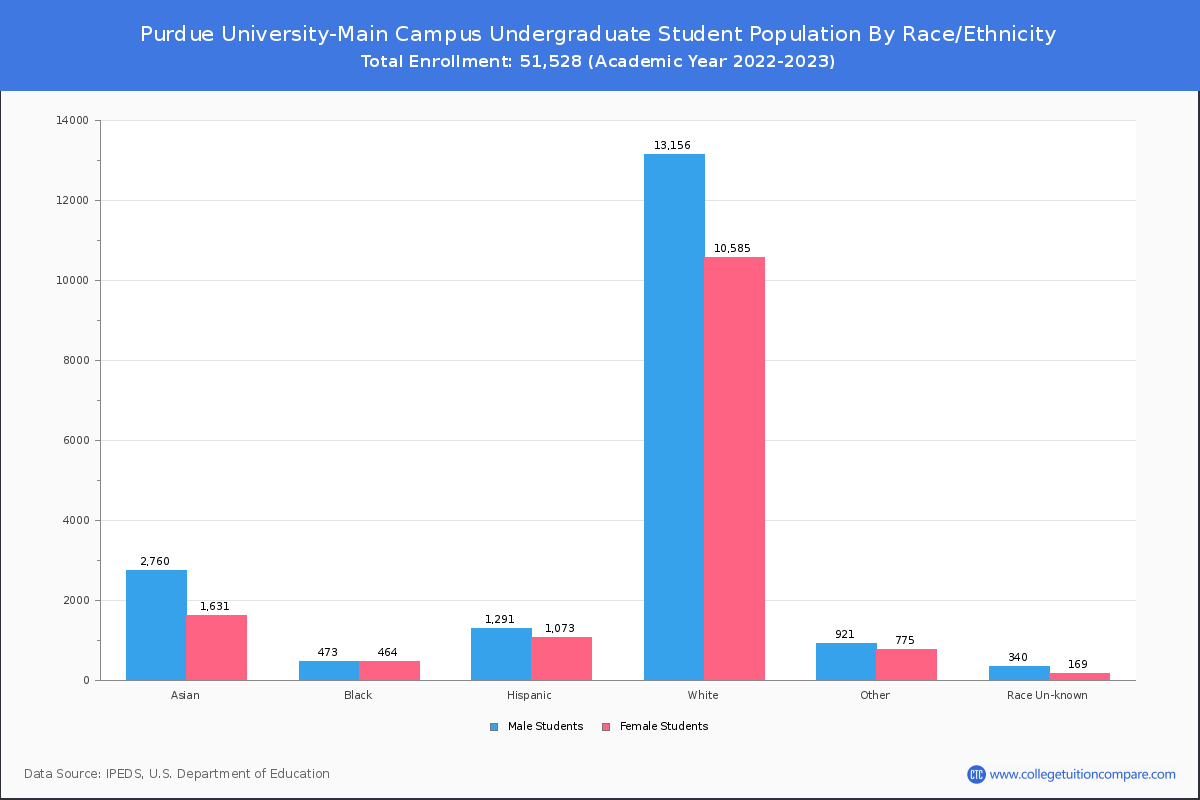
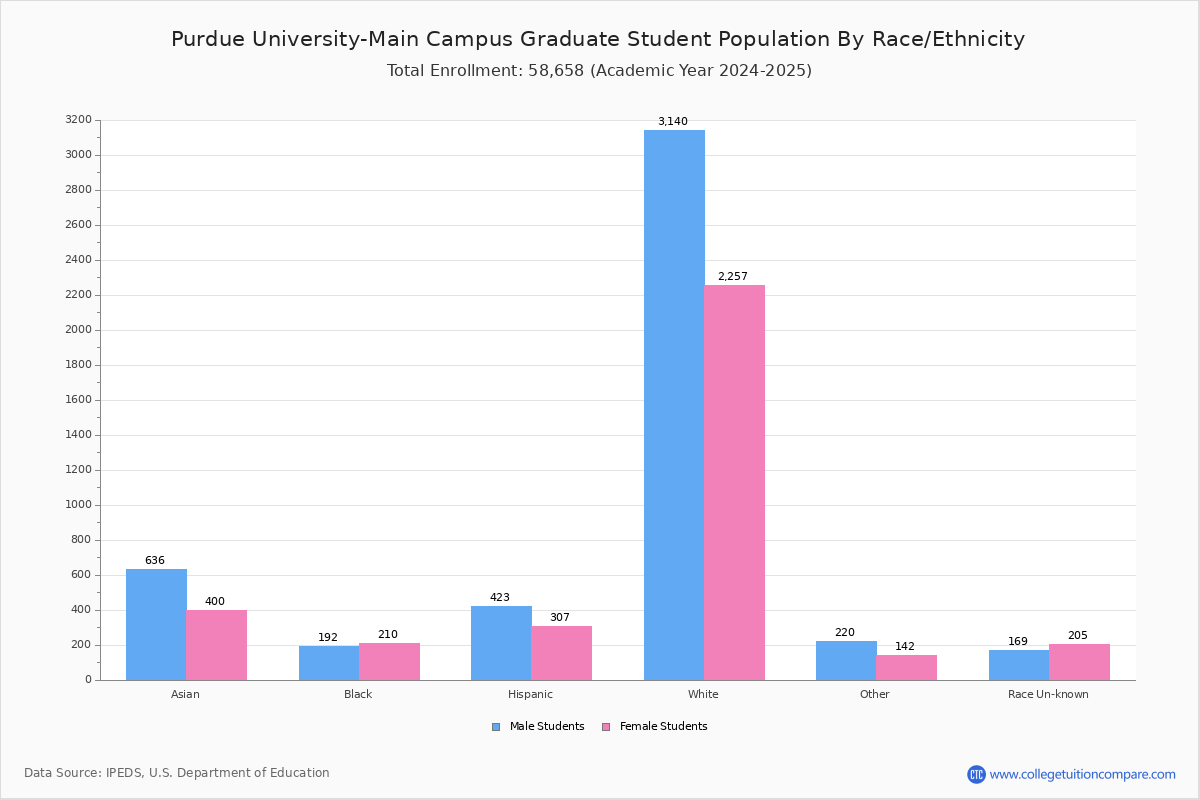
Student Distribution by Race/Ethnicity
By race/ethnicity, 28,700 White, 1,364 Black, and 5,754 Asian students out of a total of 51,528 are attending at Purdue University-Main Campus. Comprehensive enrollment statistic data by race/ethnicity is shown in the next chart (Academic year 2022-2023 data).

| Race | Total | Men | Women |
|---|---|---|---|
| American Indian or Native American | 63 | 37 | 26 |
| Asian | 5,754 | 3,541 | 2,213 |
| Black | 1,364 | 678 | 686 |
| Hispanic | 3,252 | 1,798 | 1,454 |
| Native Hawaiian or Other Pacific Islanders | 23 | 19 | 4 |
| White | 28,700 | 15,735 | 12,965 |
| Two or more races | 2,040 | 1,099 | 941 |
| Race Unknown | 892 | 526 | 366 |
| Race | Total | Men | Women |
|---|---|---|---|
| American Indian or Native American | 30 | 21 | 9 |
| Asian | 4,862 | 3,028 | 1,834 |
| Black | 960 | 500 | 460 |
| Hispanic | 2,554 | 1,413 | 1,141 |
| Native Hawaiian or Other Pacific Islanders | 20 | 16 | 4 |
| White | 23,591 | 12,928 | 10,663 |
| Two or more races | 1,771 | 963 | 808 |
| Race Unknown | 556 | 377 | 179 |
| Race | Total | Men | Women |
|---|---|---|---|
| American Indian or Native American | 0 | 0 | 0 |
| Asian | 41 | 24 | 17 |
| Black | 28 | 16 | 12 |
| Hispanic | 69 | 36 | 33 |
| Native Hawaiian or Other Pacific Islanders | 1 | 1 | 0 |
| White | 557 | 270 | 287 |
| Two or more races | 26 | 13 | 13 |
| Race Unknown | 5 | 3 | 2 |
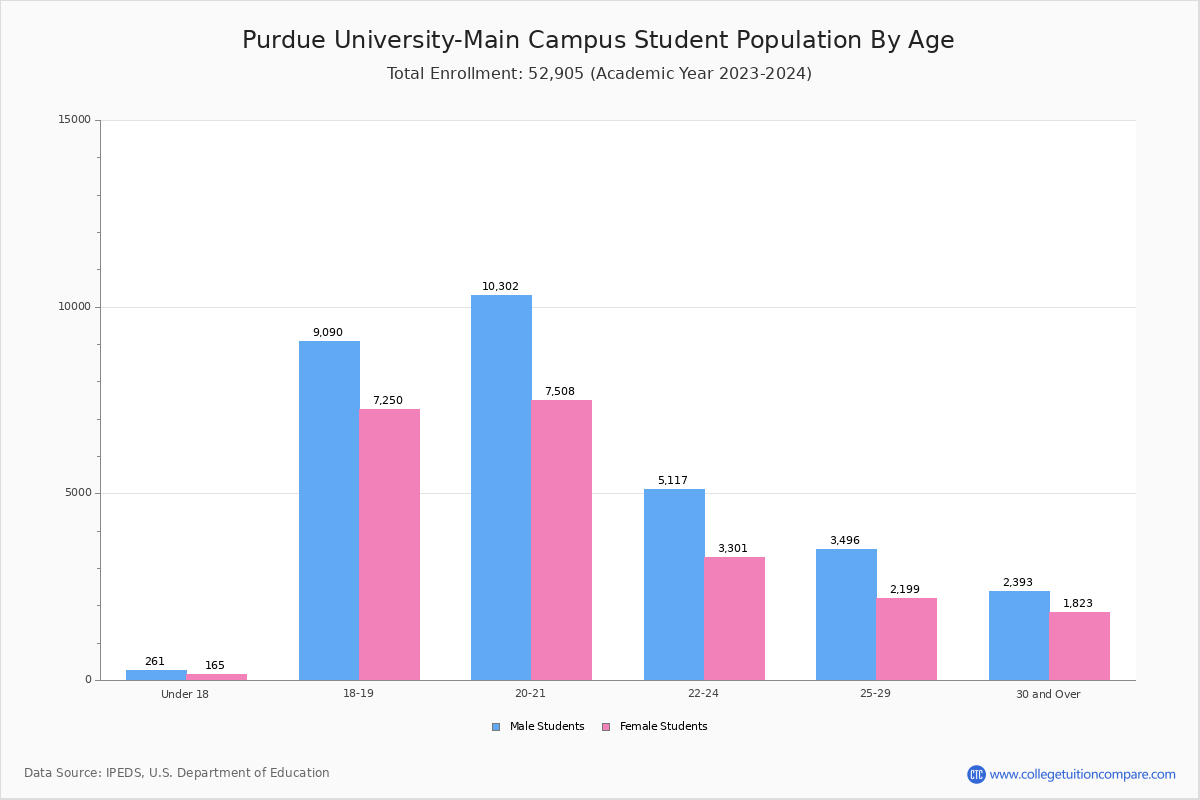
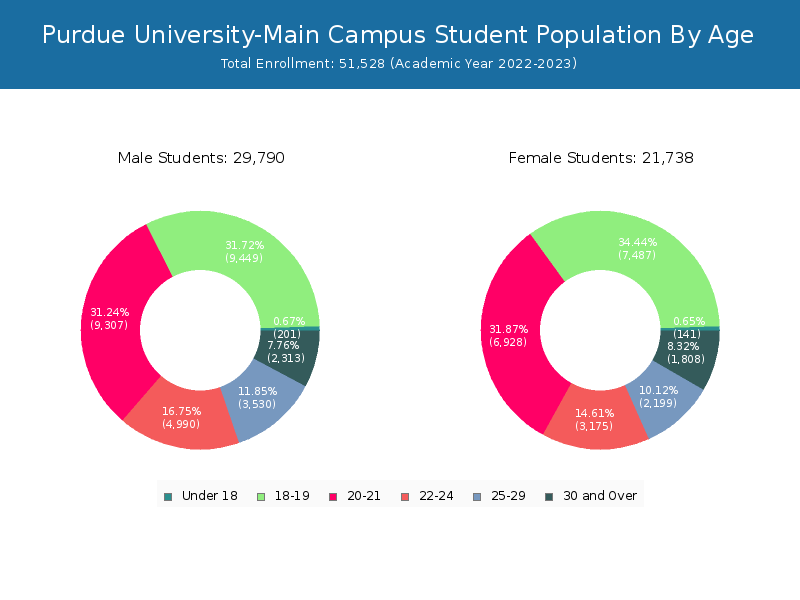
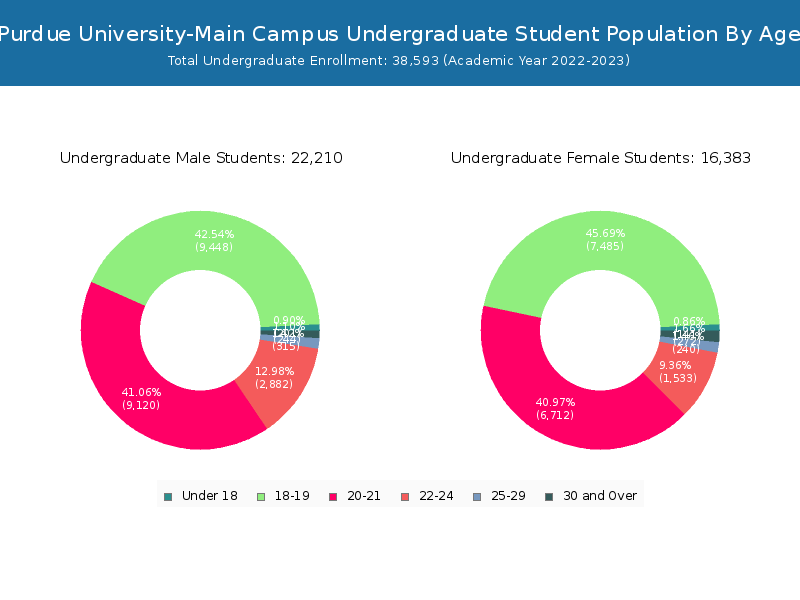
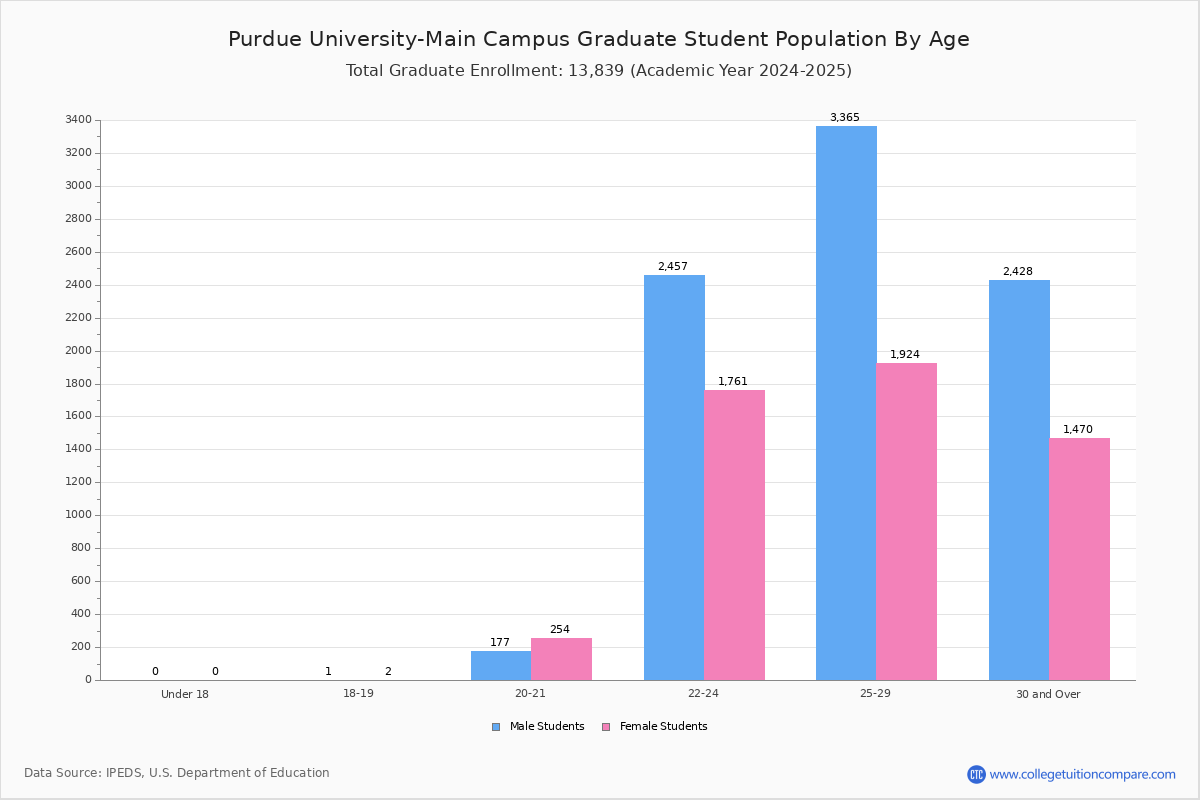
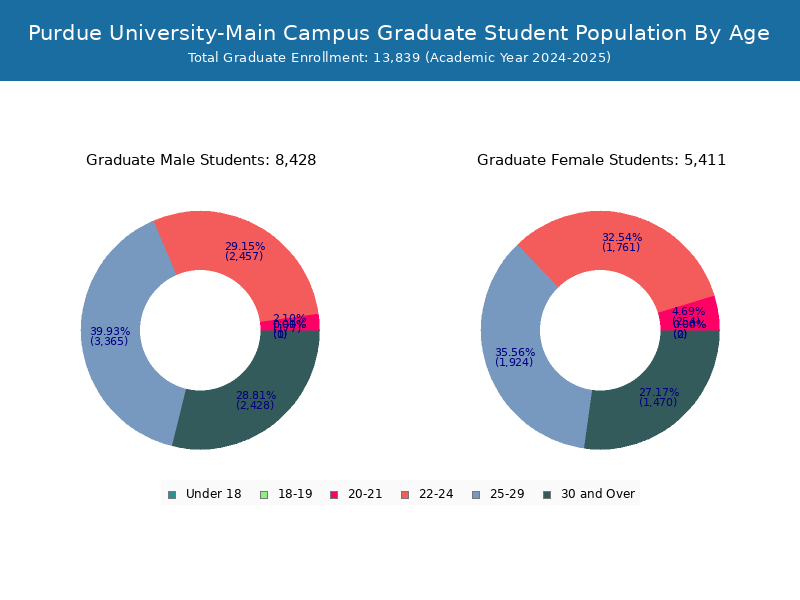
Student Age Distribution
By age, PU has 342 students under 18 years old and 26 students over 65 years old. There are 41,678 students under 25 years old, and 9,850 students over 25 years old out of 51,528 total students.
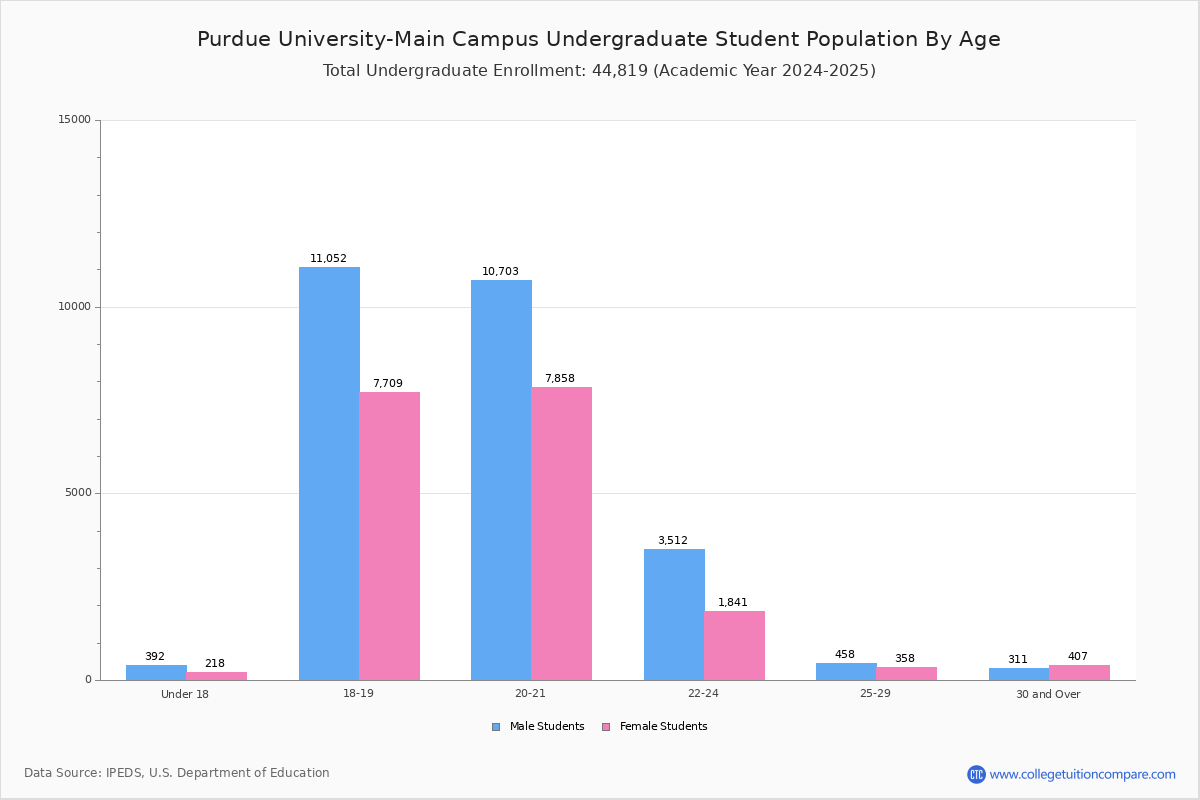
In undergraduate programs, 342 students are younger than 18 and 10 students are older than 65. PU has 37,522 undergraduate students aged under 25 and 1,071 students aged 25 and over.
It has 4,156 graduate students aged under 25 and 8,779 students aged 25 and over.
| Age | Total | Men | Women |
|---|---|---|---|
| Under 18 | 342 | 141 | 201 |
| 18-19 | 16,936 | 7,487 | 9,449 |
| 20-21 | 16,235 | 6,928 | 9,307 |
| 22-24 | 8,165 | 3,175 | 4,990 |
| 25-29 | 5,729 | 2,199 | 3,530 |
| 30-34 | 2,022 | 842 | 1,180 |
| 35-39 | 891 | 374 | 517 |
| 40-49 | 838 | 422 | 416 |
| 50-64 | 344 | 162 | 182 |
| Over 65 | 26 | 8 | 18 |
| Age | Total | Men | Women |
|---|---|---|---|
| Under 18 | 342 | 141 | 201 |
| 18-19 | 16,933 | 7,485 | 9,448 |
| 20-21 | 15,832 | 6,712 | 9,120 |
| 22-24 | 4,415 | 1,533 | 2,882 |
| 25-29 | 555 | 240 | 315 |
| 30-34 | 212 | 113 | 99 |
| 35-39 | 121 | 61 | 60 |
| 40-49 | 121 | 61 | 60 |
| 50-64 | 52 | 33 | 19 |
| Over 65 | 10 | 4 | 6 |
| Age | Total | Men | Women |
|---|
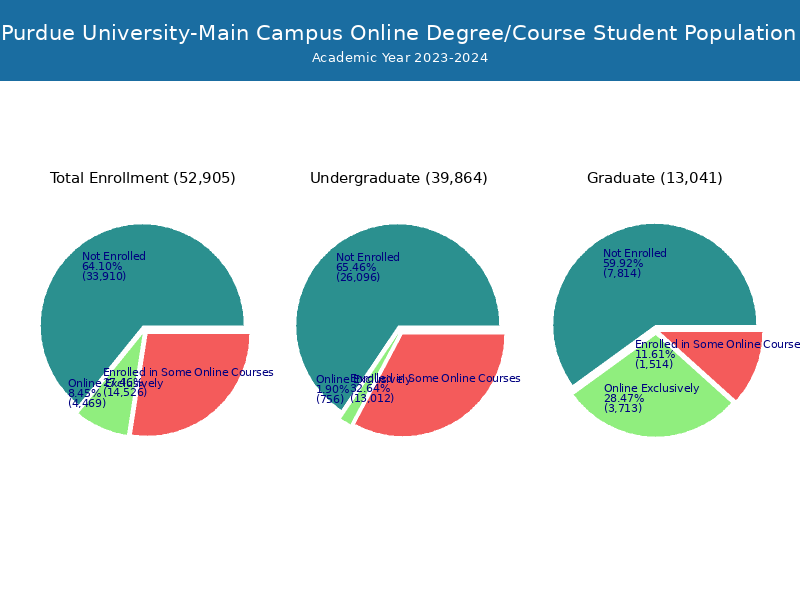
Online Student Enrollment
Distance learning, also called online education, is very attractive to students, especially who want to continue education and work in field. At Purdue University-Main Campus, 4,437 students are enrolled exclusively in online courses and 13,394 students are enrolled in some online courses.
1,090 students lived in Indiana or jurisdiction in which the school is located are enrolled exclusively in online courses and 3,347 students live in other State or outside of the United States.
| All Students | Enrolled Exclusively Online Courses | Enrolled in Some Online Courses | |
|---|---|---|---|
| All Students | 51,528 | 4,437 | 13,394 |
| Undergraduate | 38,593 | 672 | 12,221 |
| Graduate | 12,935 | 3,765 | 1,173 |
| Indiana Residents | Other States in U.S. | Outside of U.S. | |
|---|---|---|---|
| All Students | 1,090 | 2,958 | 389 |
| Undergraduate | 304 | 343 | 25 |
| Graduate | 786 | 2,615 | 364 |
Transfer-in Students (Undergraduate)
Among 38,593 enrolled in undergraduate programs, 1,042 students have transferred-in from other institutions. The percentage of transfer-in students is 2.70%.869 students have transferred in as full-time status and 173 students transferred in as part-time status.
| Number of Students | |
|---|---|
| Regular Full-time | 35,615 |
| Transfer-in Full-time | 869 |
| Regular Part-time | 1,936 |
| Transfer-in Part-time | 173 |