Student Population by Gender
Virginia Polytechnic Institute and State University has a total of 38,170 enrolled students for the academic year 2022-2023. 30,434 students have enrolled in undergraduate programs and 7,736 students joined graduate programs.
By gender, 21,687 male and 16,483 female students (the male-female ratio is 57:43) are attending the school. The gender distribution is based on the 2022-2023 data.
| Total | Undergraduate | Graduate | |
|---|---|---|---|
| Total | 38,170 | 30,434 | 7,736 |
| Men | 21,687 | 17,378 | 4,309 |
| Women | 16,483 | 13,056 | 3,427 |
Student Distribution by Race/Ethnicity
| Race | Total | Men | Women |
|---|---|---|---|
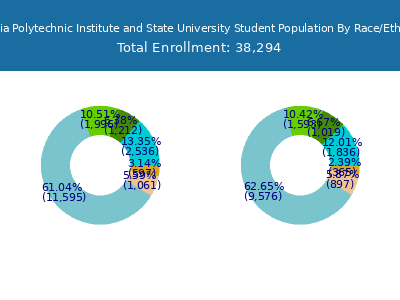
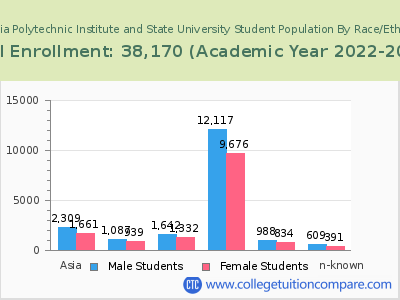
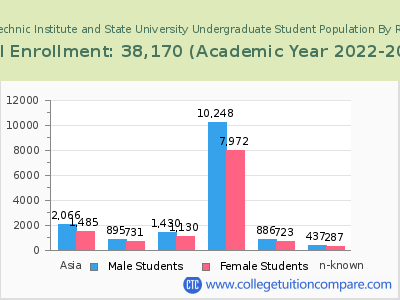
| American Indian or Native American | 42 | 24 | 18 |
| Asian | 4,186 | 2,425 | 1,761 |
| Black | 2,182 | 1,200 | 982 |
| Hispanic | 3,348 | 1,851 | 1,497 |
| Native Hawaiian or Other Pacific Islanders | 38 | 21 | 17 |
| White | 21,693 | 11,902 | 9,791 |
| Two or more races | 1,805 | 995 | 810 |
| Race Unknown | 992 | 604 | 388 |
| Race | Total | Men | Women |
|---|---|---|---|
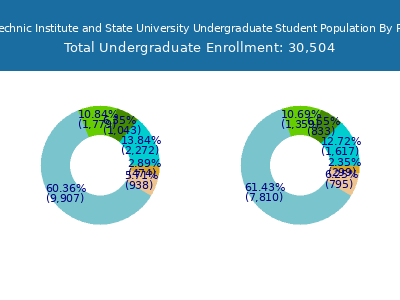
| American Indian or Native American | 34 | 20 | 14 |
| Asian | 3,733 | 2,165 | 1,568 |
| Black | 1,807 | 1,012 | 795 |
| Hispanic | 2,904 | 1,637 | 1,267 |
| Native Hawaiian or Other Pacific Islanders | 37 | 20 | 17 |
| White | 18,166 | 10,149 | 8,017 |
| Two or more races | 1,592 | 891 | 701 |
| Race Unknown | 781 | 472 | 309 |
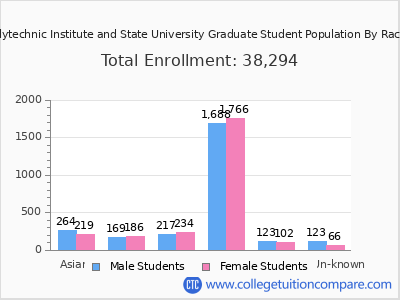
| Race | Total | Men | Women |
|---|---|---|---|
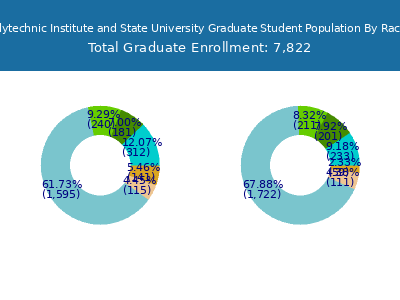
| American Indian or Native American | 1 | 0 | 1 |
| Asian | 127 | 95 | 32 |
| Black | 48 | 33 | 15 |
| Hispanic | 103 | 55 | 48 |
| Native Hawaiian or Other Pacific Islanders | 0 | 0 | 0 |
| White | 612 | 371 | 241 |
| Two or more races | 48 | 34 | 14 |
| Race Unknown | 23 | 12 | 11 |
Student Age Distribution
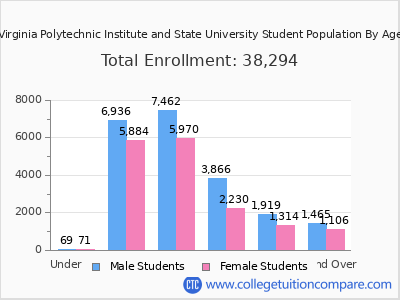
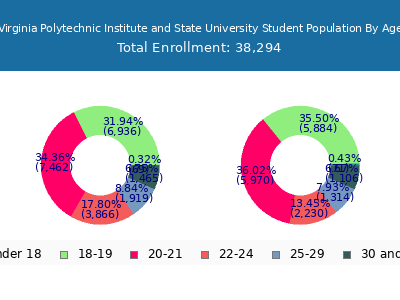
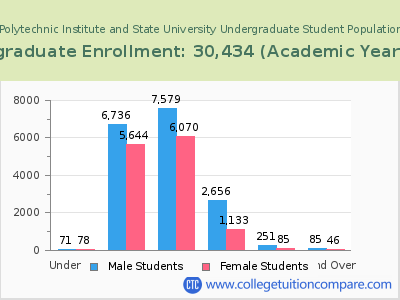
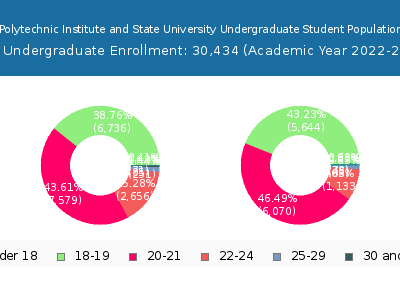
By age, Virginia Tech has 149 students under 18 years old and 17 students over 65 years old. There are 32,295 students under 25 years old, and 5,875 students over 25 years old out of 38,170 total students.
In undergraduate programs, 149 students are younger than 18 and 2 students are older than 65. Virginia Tech has 29,967 undergraduate students aged under 25 and 467 students aged 25 and over.
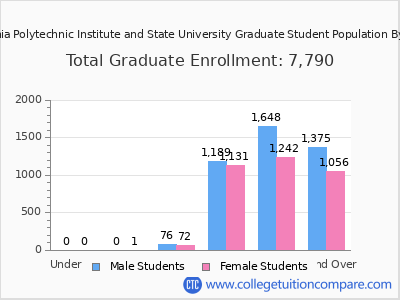
It has 2,328 graduate students aged under 25 and 5,408 students aged 25 and over.
| Age | Total | Men | Women |
|---|---|---|---|
| Under 18 | 149 | 78 | 71 |
| 18-19 | 12,380 | 5,644 | 6,736 |
| 20-21 | 13,772 | 6,137 | 7,635 |
| 22-24 | 5,994 | 2,197 | 3,797 |
| 25-29 | 3,272 | 1,306 | 1,966 |
| 30-34 | 1,234 | 506 | 728 |
| 35-39 | 540 | 224 | 316 |
| 40-49 | 557 | 266 | 291 |
| 50-64 | 255 | 122 | 133 |
| Over 65 | 17 | 3 | 14 |
| Age | Total | Men | Women |
|---|---|---|---|
| Under 18 | 149 | 78 | 71 |
| 18-19 | 12,380 | 5,644 | 6,736 |
| 20-21 | 13,649 | 6,070 | 7,579 |
| 22-24 | 3,789 | 1,133 | 2,656 |
| 25-29 | 336 | 85 | 251 |
| 30-34 | 69 | 19 | 50 |
| 35-39 | 29 | 13 | 16 |
| 40-49 | 22 | 11 | 11 |
| 50-64 | 9 | 2 | 7 |
| Over 65 | 2 | 1 | 1 |
| Age | Total | Men | Women |
|---|
Online Student Enrollment
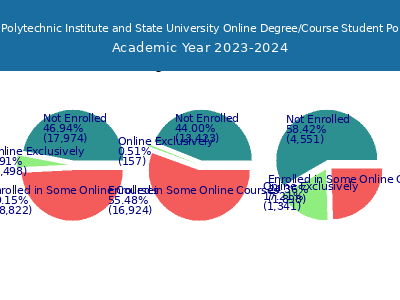
Distance learning, also called online education, is very attractive to students, especially who want to continue education and work in field. At Virginia Polytechnic Institute and State University, 1,625 students are enrolled exclusively in online courses and 19,391 students are enrolled in some online courses.
1,169 students lived in Virginia or jurisdiction in which the school is located are enrolled exclusively in online courses and 456 students live in other State or outside of the United States.
| All Students | Enrolled Exclusively Online Courses | Enrolled in Some Online Courses | |
|---|---|---|---|
| All Students | 38,170 | 1,625 | 19,391 |
| Undergraduate | 30,434 | 180 | 17,338 |
| Graduate | 7,736 | 1,445 | 2,053 |
| Virginia Residents | Other States in U.S. | Outside of U.S. | |
|---|---|---|---|
| All Students | 1,169 | 453 | 3 |
| Undergraduate | 171 | 8 | 1 |
| Graduate | 998 | 445 | 2 |
Transfer-in Students (Undergraduate)
Among 30,434 enrolled in undergraduate programs, 997 students have transferred-in from other institutions. The percentage of transfer-in students is 3.28%.973 students have transferred in as full-time status and 24 students transferred in as part-time status.
| Number of Students | |
|---|---|
| Regular Full-time | 28,596 |
| Transfer-in Full-time | 973 |
| Regular Part-time | 841 |
| Transfer-in Part-time | 24 |
