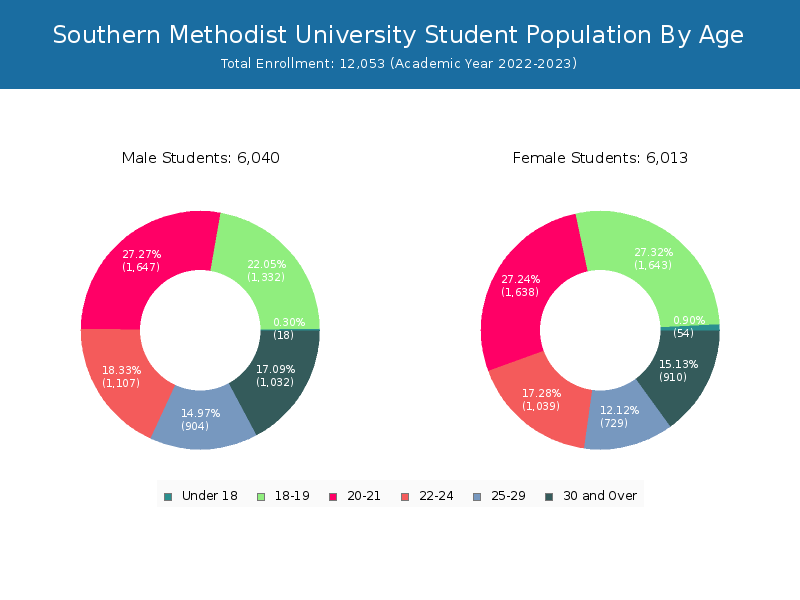
Student Population by Gender
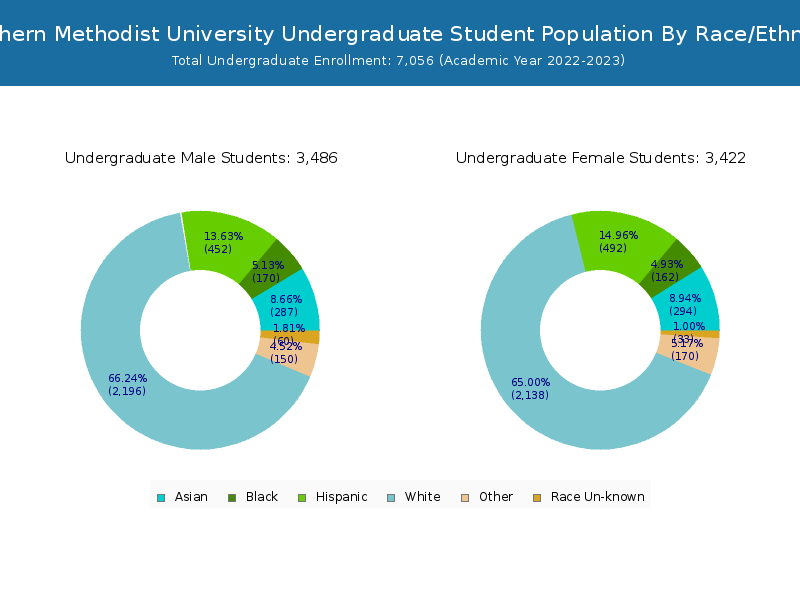
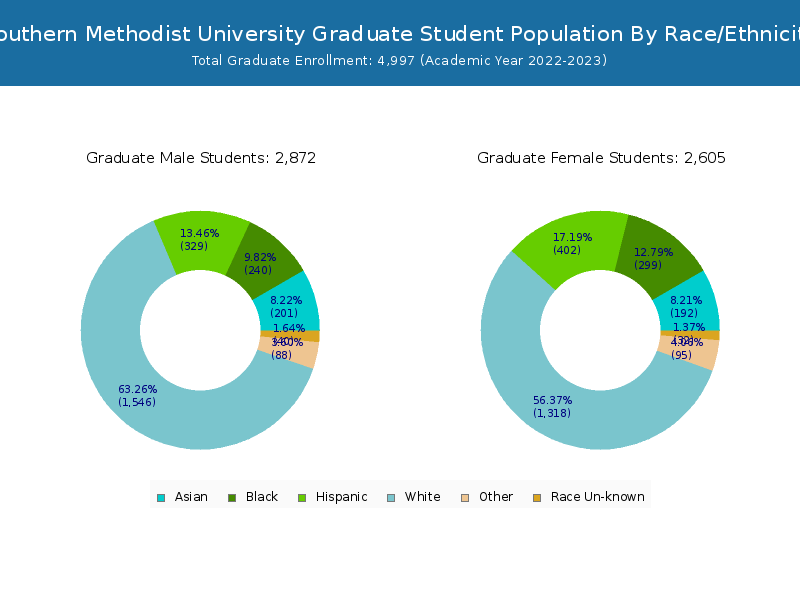
Southern Methodist University has a total of 12,053 enrolled students for the academic year 2022-2023. 7,056 students have enrolled in undergraduate programs and 4,997 students joined graduate programs.
By gender, 6,040 male and 6,013 female students (the male-female ratio is 50:50) are attending the school. The gender distribution is based on the 2022-2023 data.
| Total | Undergraduate | Graduate | |
|---|---|---|---|
| Total | 12,053 | 7,056 | 4,997 |
| Men | 6,040 | 3,478 | 2,562 |
| Women | 6,013 | 3,578 | 2,435 |
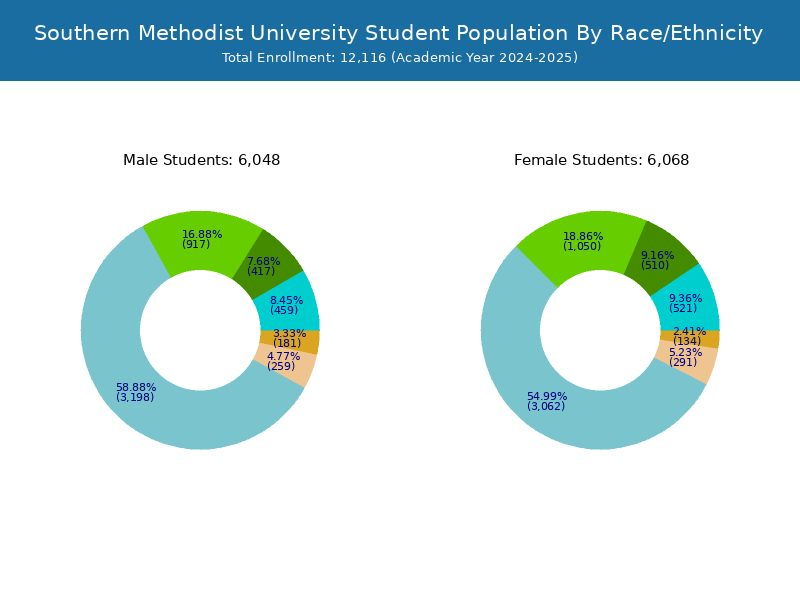
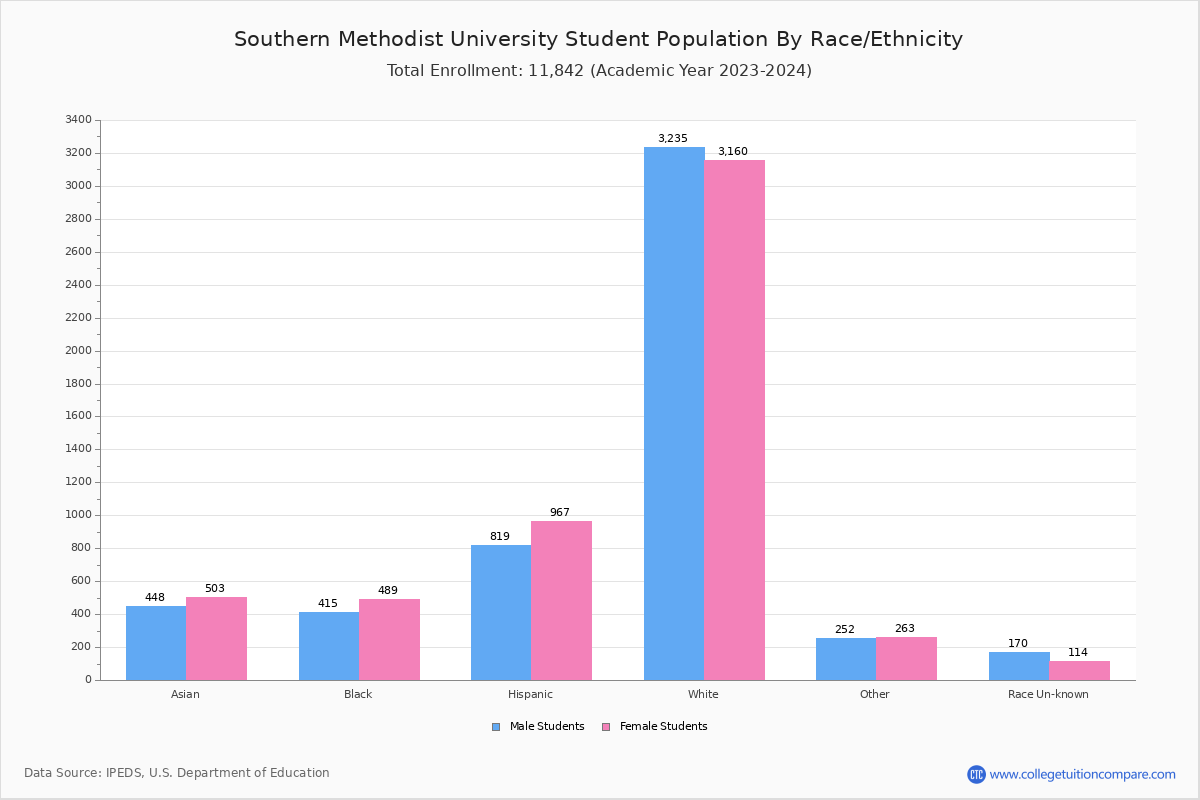
Student Distribution by Race/Ethnicity
By race/ethnicity, 6,824 White, 846 Black, and 960 Asian students out of a total of 12,053 are attending at Southern Methodist University. Comprehensive enrollment statistic data by race/ethnicity is shown in the next chart (Academic year 2022-2023 data).
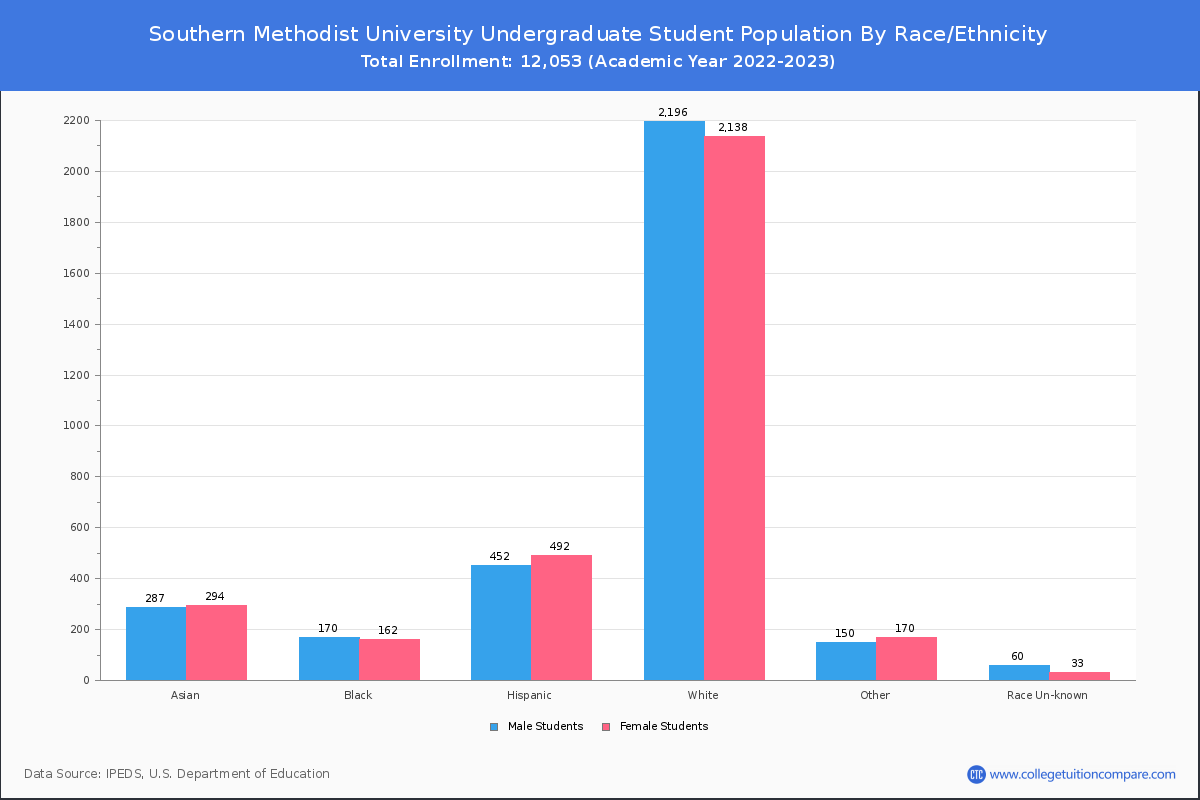
| Race | Total | Men | Women |
|---|---|---|---|
| American Indian or Native American | 27 | 13 | 14 |
| Asian | 960 | 459 | 501 |
| Black | 846 | 392 | 454 |
| Hispanic | 1,680 | 772 | 908 |
| Native Hawaiian or Other Pacific Islanders | 8 | 6 | 2 |
| White | 6,824 | 3,462 | 3,362 |
| Two or more races | 466 | 212 | 254 |
| Race Unknown | 235 | 137 | 98 |
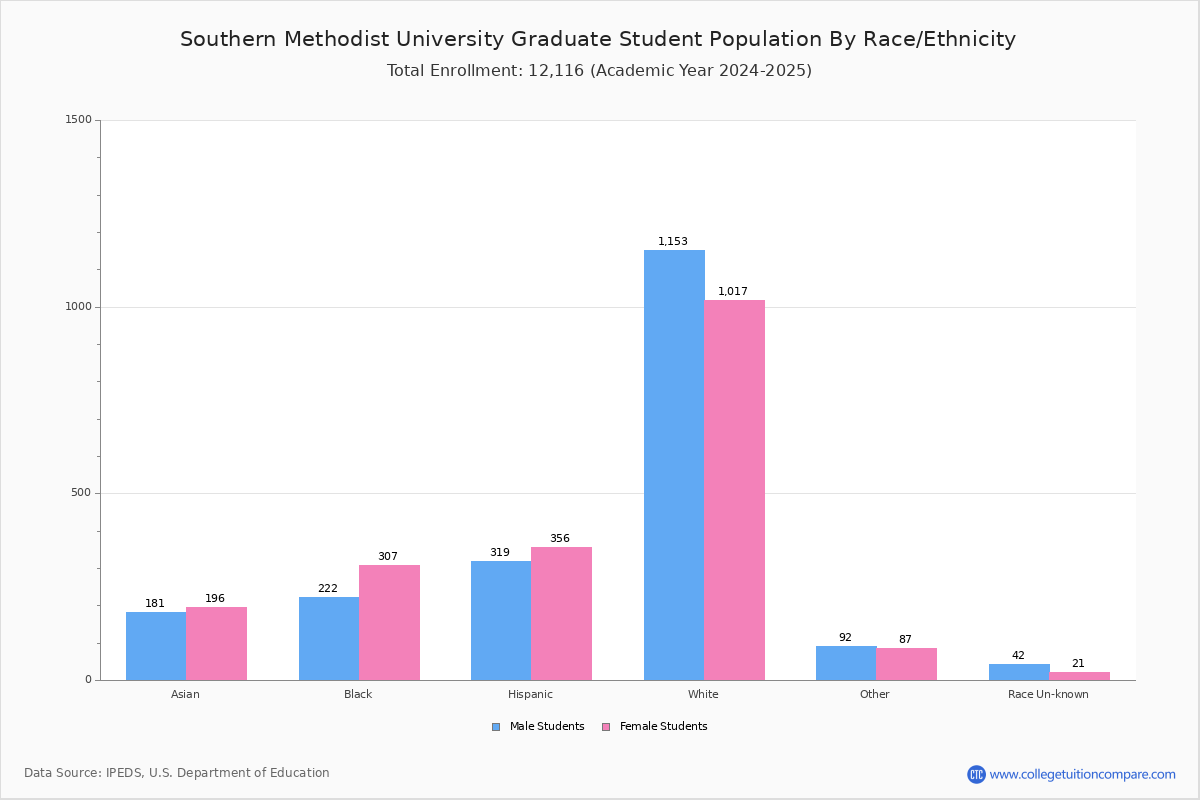
| Race | Total | Men | Women |
|---|---|---|---|
| American Indian or Native American | 20 | 10 | 10 |
| Asian | 586 | 270 | 316 |
| Black | 349 | 178 | 171 |
| Hispanic | 1,026 | 480 | 546 |
| Native Hawaiian or Other Pacific Islanders | 6 | 5 | 1 |
| White | 4,278 | 2,143 | 2,135 |
| Two or more races | 327 | 139 | 188 |
| Race Unknown | 172 | 99 | 73 |
| Race | Total | Men | Women |
|---|---|---|---|
| American Indian or Native American | 1 | 0 | 1 |
| Asian | 20 | 8 | 12 |
| Black | 30 | 18 | 12 |
| Hispanic | 64 | 29 | 35 |
| Native Hawaiian or Other Pacific Islanders | 0 | 0 | 0 |
| White | 106 | 55 | 51 |
| Two or more races | 15 | 8 | 7 |
| Race Unknown | 7 | 2 | 5 |
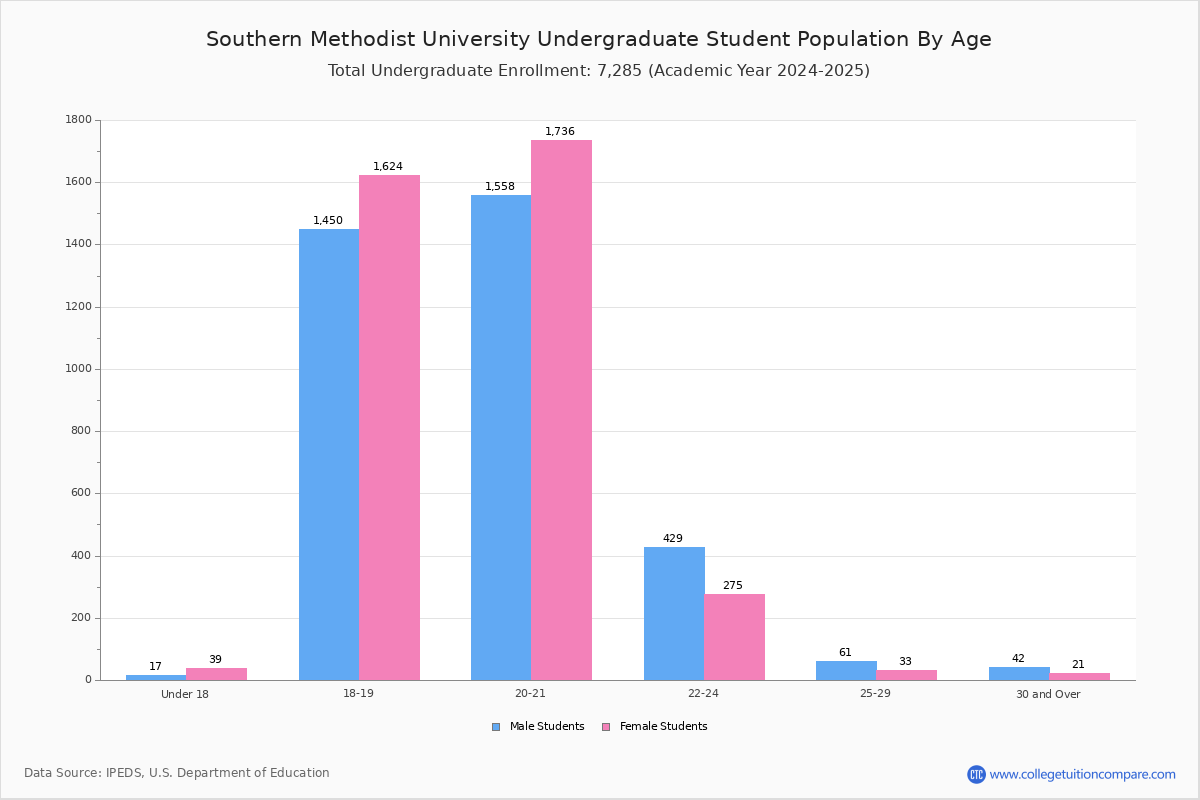
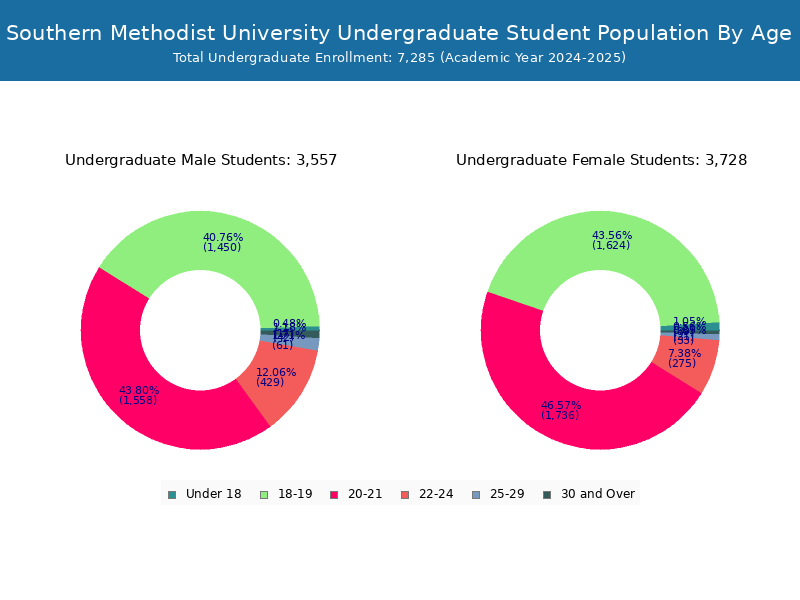
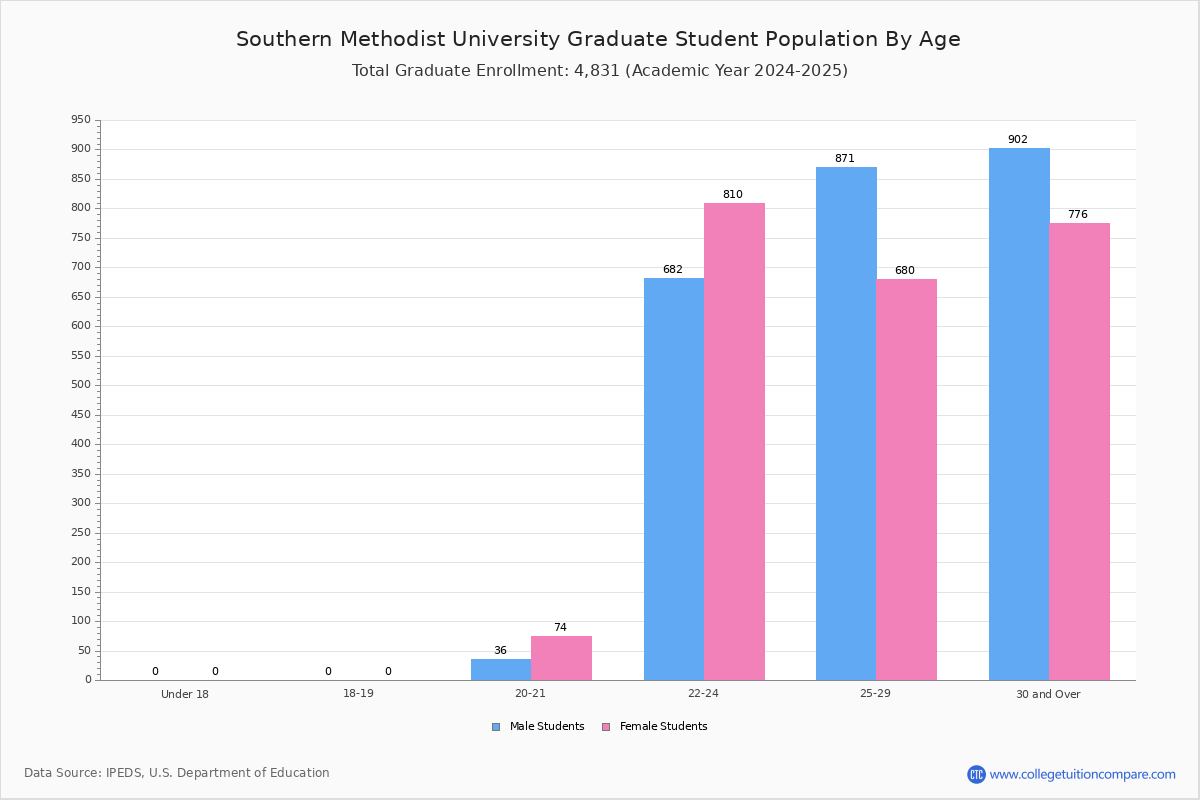
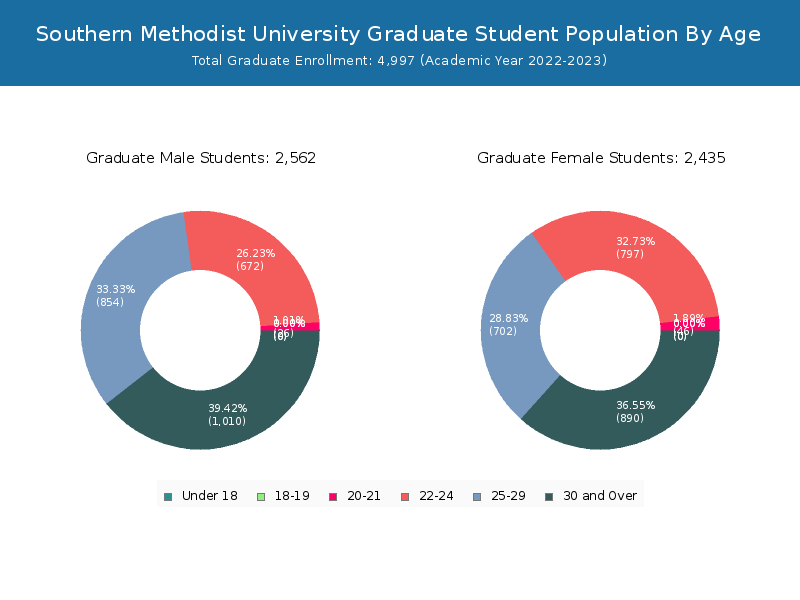
Student Age Distribution
By age, SMU has 72 students under 18 years old and 39 students over 65 years old. There are 8,478 students under 25 years old, and 3,575 students over 25 years old out of 12,053 total students.
SMU has 6,937 undergraduate students aged under 25 and 119 students aged 25 and over.
It has 1,541 graduate students aged under 25 and 3,456 students aged 25 and over.
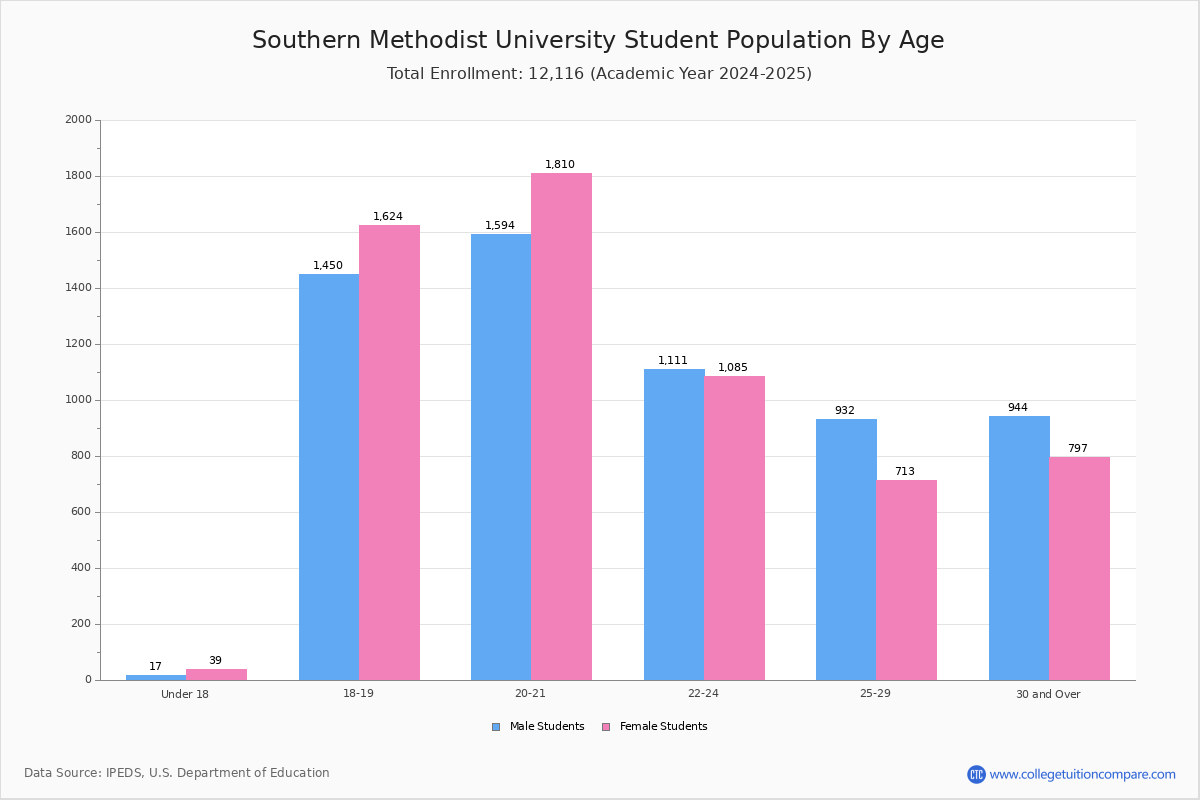
| Age | Total | Men | Women |
|---|---|---|---|
| Under 18 | 72 | 54 | 18 |
| 18-19 | 2,975 | 1,643 | 1,332 |
| 20-21 | 3,285 | 1,638 | 1,647 |
| 22-24 | 2,146 | 1,039 | 1,107 |
| 25-29 | 1,633 | 729 | 904 |
| 30-34 | 761 | 303 | 458 |
| 35-39 | 431 | 187 | 244 |
| 40-49 | 470 | 250 | 220 |
| 50-64 | 241 | 148 | 93 |
| Over 65 | 39 | 22 | 17 |
| Age | Total | Men | Women |
|---|---|---|---|
| Under 18 | 72 | 54 | 18 |
| 18-19 | 2,975 | 1,643 | 1,332 |
| 20-21 | 3,213 | 1,592 | 1,621 |
| 22-24 | 677 | 242 | 435 |
| 25-29 | 77 | 27 | 50 |
| 30-34 | 21 | 9 | 12 |
| 35-39 | 10 | 4 | 6 |
| 40-49 | 9 | 5 | 4 |
| 50-64 | 2 | 2 | 0 |
| Age | Total | Men | Women |
|---|
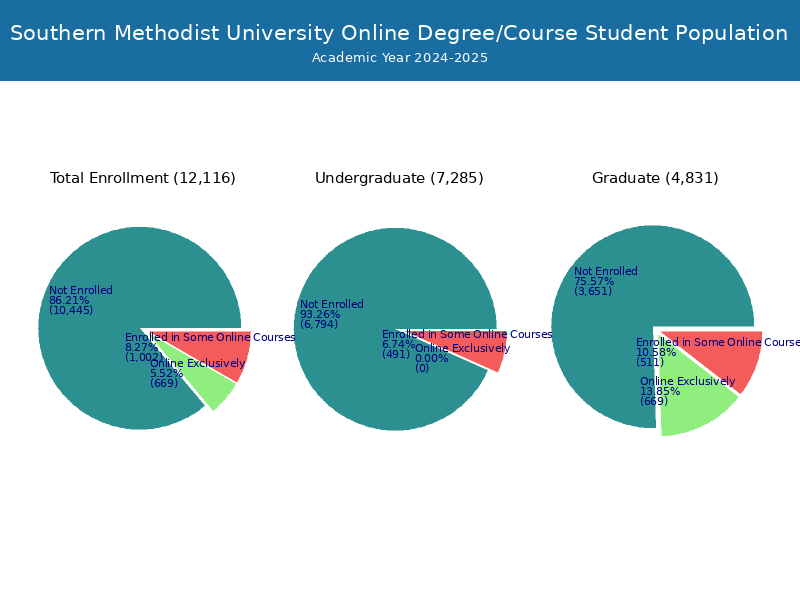
Online Student Enrollment
Distance learning, also called online education, is very attractive to students, especially who want to continue education and work in field. At Southern Methodist University, 892 students are enrolled exclusively in online courses and 706 students are enrolled in some online courses.
678 students lived in Texas or jurisdiction in which the school is located are enrolled exclusively in online courses and 214 students live in other State or outside of the United States.
| All Students | Enrolled Exclusively Online Courses | Enrolled in Some Online Courses | |
|---|---|---|---|
| All Students | 12,053 | 892 | 706 |
| Undergraduate | 7,056 | 1 | 392 |
| Graduate | 4,997 | 891 | 314 |
| Texas Residents | Other States in U.S. | Outside of U.S. | |
|---|---|---|---|
| All Students | 678 | 197 | 17 |
| Undergraduate | 1 | - | 0 |
| Graduate | 677 | 197 | 17 |
Transfer-in Students (Undergraduate)
Among 7,056 enrolled in undergraduate programs, 269 students have transferred-in from other institutions. The percentage of transfer-in students is 3.81%.260 students have transferred in as full-time status and 9 students transferred in as part-time status.
| Number of Students | |
|---|---|
| Regular Full-time | 6,620 |
| Transfer-in Full-time | 260 |
| Regular Part-time | 167 |
| Transfer-in Part-time | 9 |