Student Population by Gender
Baylor University has a total of 20,709 enrolled students for the academic year 2022-2023. 15,213 students have enrolled in undergraduate programs and 5,496 students joined graduate programs.
By gender, 8,045 male and 12,664 female students (the male-female ratio is 39:61) are attending the school. The gender distribution is based on the 2022-2023 data.
| Total | Undergraduate | Graduate | |
|---|---|---|---|
| Total | 20,709 | 15,213 | 5,496 |
| Men | 8,045 | 6,153 | 1,892 |
| Women | 12,664 | 9,060 | 3,604 |
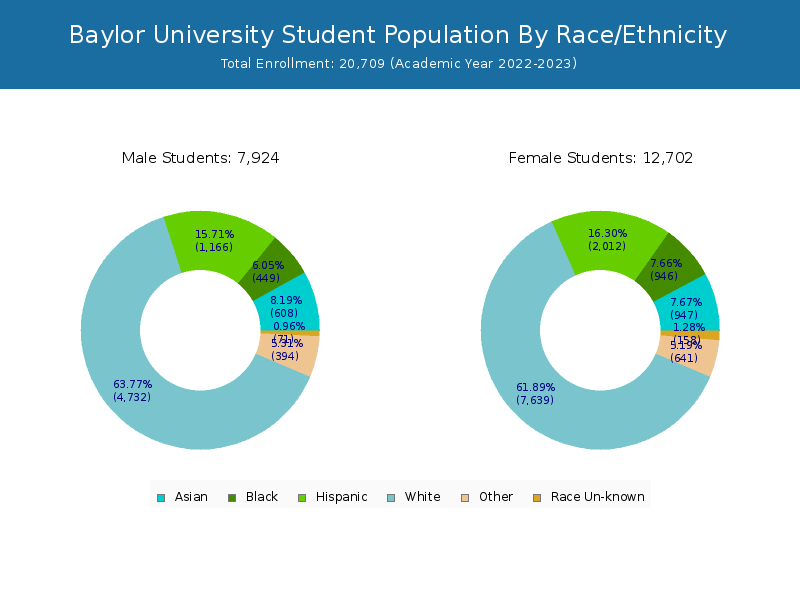
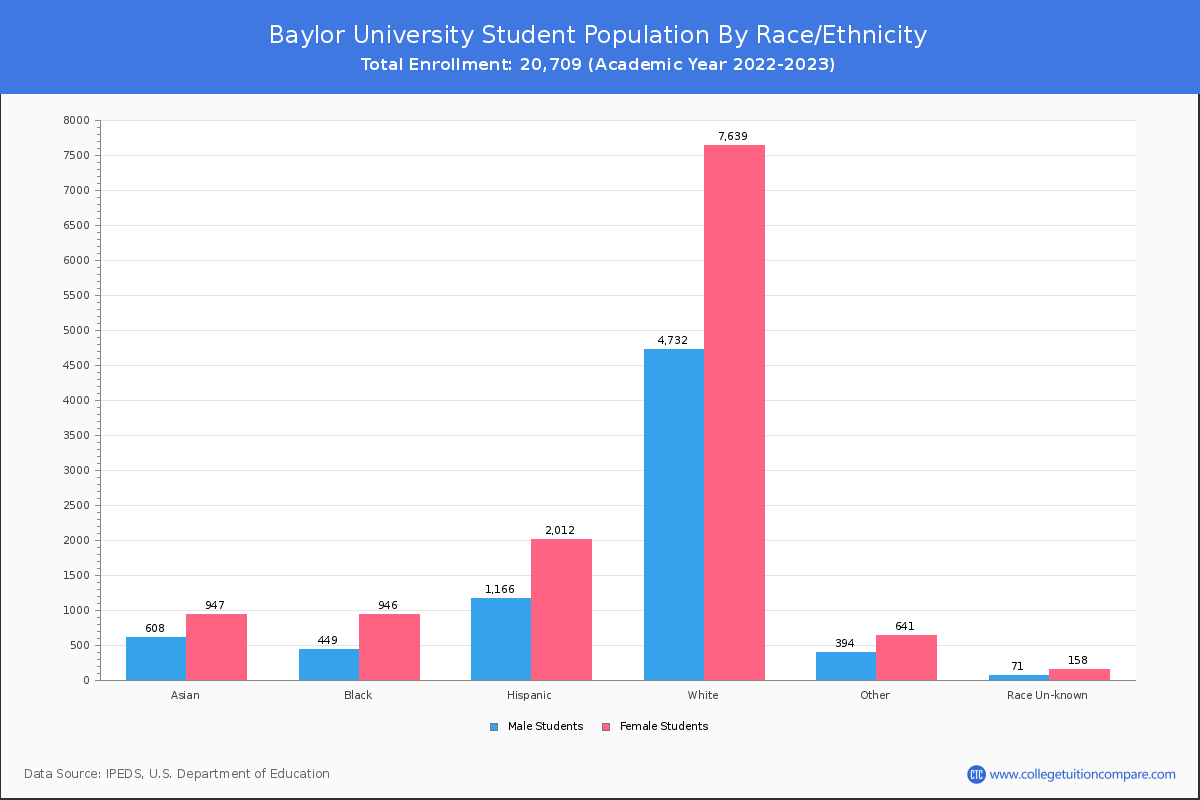
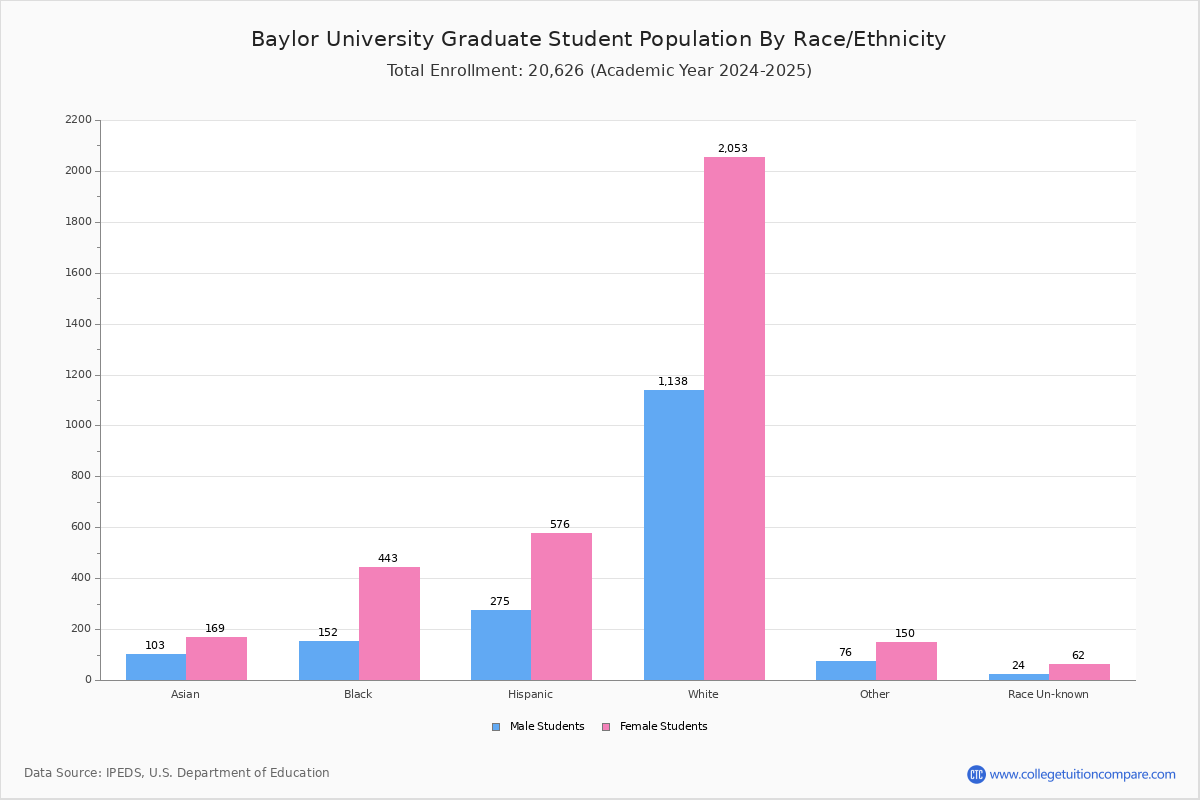
Student Distribution by Race/Ethnicity
By race/ethnicity, 12,480 White, 1,323 Black, and 1,586 Asian students out of a total of 20,709 are attending at Baylor University. Comprehensive enrollment statistic data by race/ethnicity is shown in the next chart (Academic year 2022-2023 data).
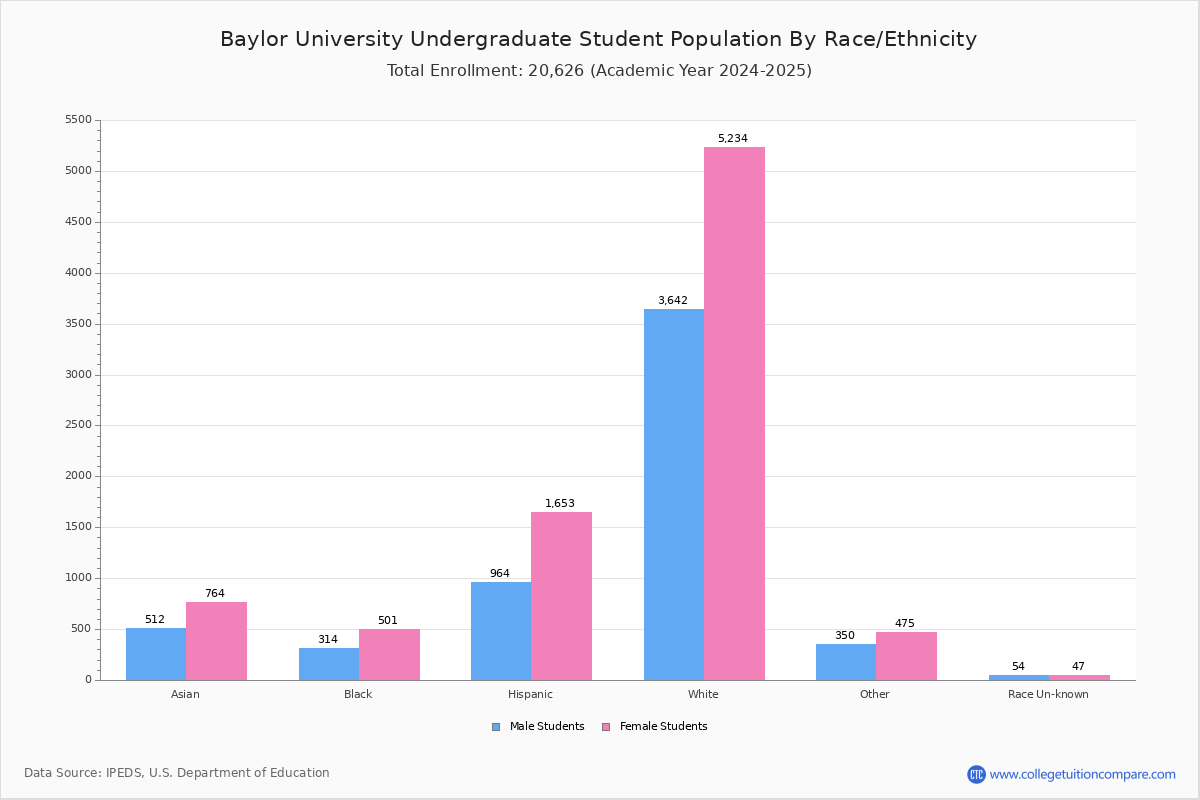
| Race | Total | Men | Women |
|---|---|---|---|
| American Indian or Native American | 69 | 22 | 47 |
| Asian | 1,586 | 618 | 968 |
| Black | 1,323 | 433 | 890 |
| Hispanic | 3,197 | 1,170 | 2,027 |
| Native Hawaiian or Other Pacific Islanders | 29 | 15 | 14 |
| White | 12,480 | 4,832 | 7,648 |
| Two or more races | 932 | 373 | 559 |
| Race Unknown | 192 | 67 | 125 |
| Race | Total | Men | Women |
|---|---|---|---|
| American Indian or Native American | 37 | 15 | 22 |
| Asian | 1,328 | 524 | 804 |
| Black | 733 | 281 | 452 |
| Hispanic | 2,425 | 945 | 1,480 |
| Native Hawaiian or Other Pacific Islanders | 21 | 13 | 8 |
| White | 9,281 | 3,712 | 5,569 |
| Two or more races | 754 | 317 | 437 |
| Race Unknown | 95 | 52 | 43 |
| Race | Total | Men | Women |
|---|---|---|---|
| American Indian or Native American | 0 | 0 | 0 |
| Asian | 21 | 8 | 13 |
| Black | 32 | 10 | 22 |
| Hispanic | 75 | 34 | 41 |
| Native Hawaiian or Other Pacific Islanders | 1 | 0 | 1 |
| White | 195 | 82 | 113 |
| Two or more races | 20 | 11 | 9 |
| Race Unknown | 0 | 0 | 0 |
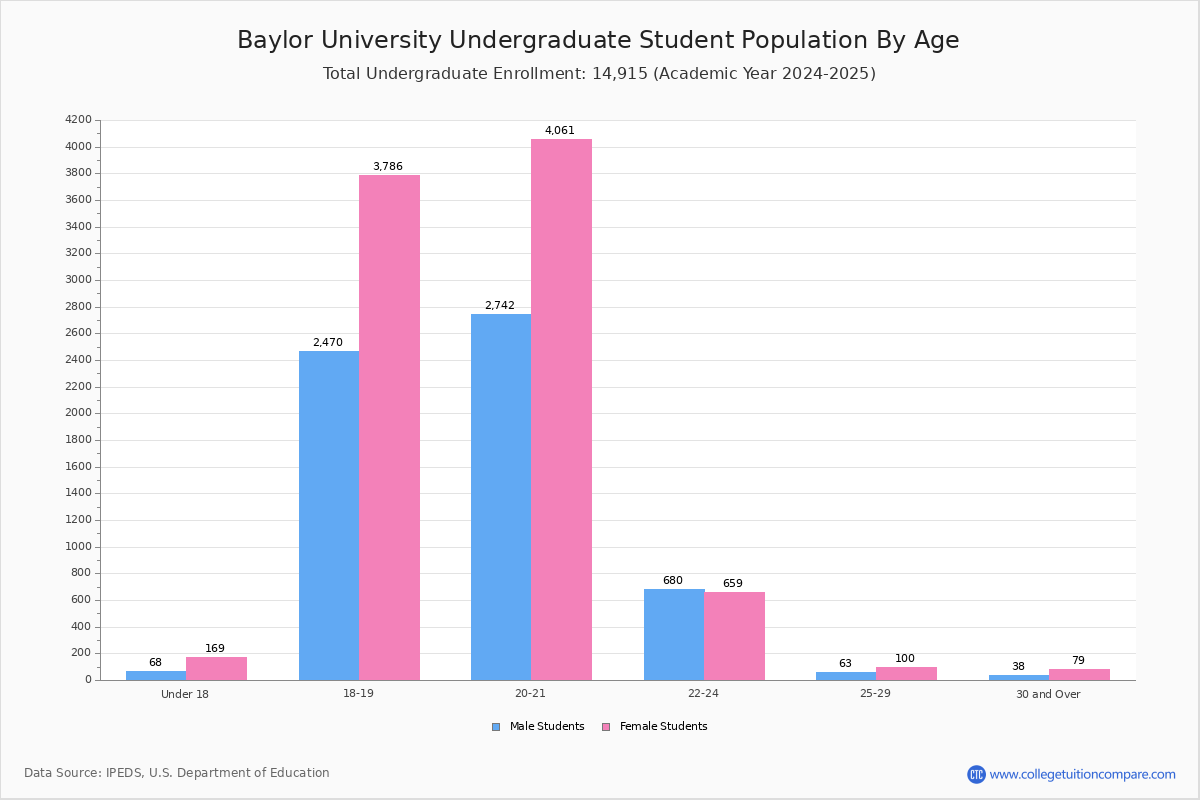
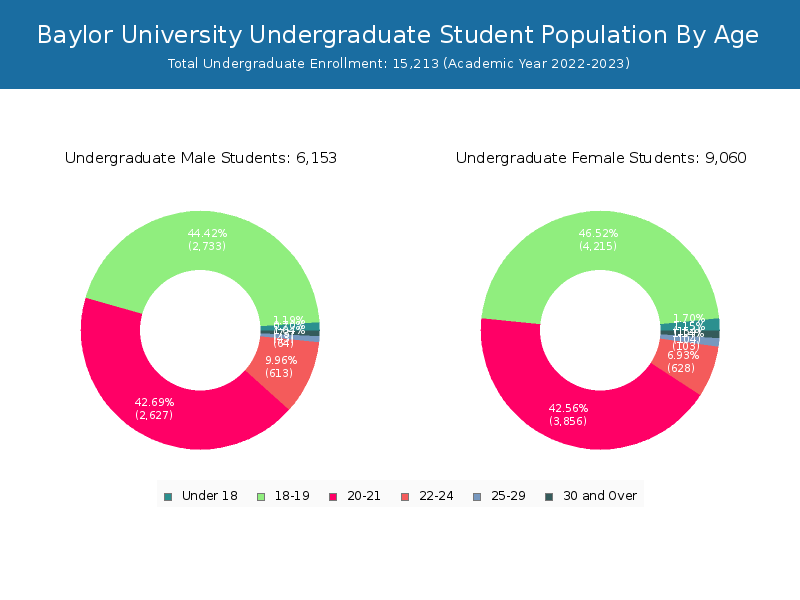
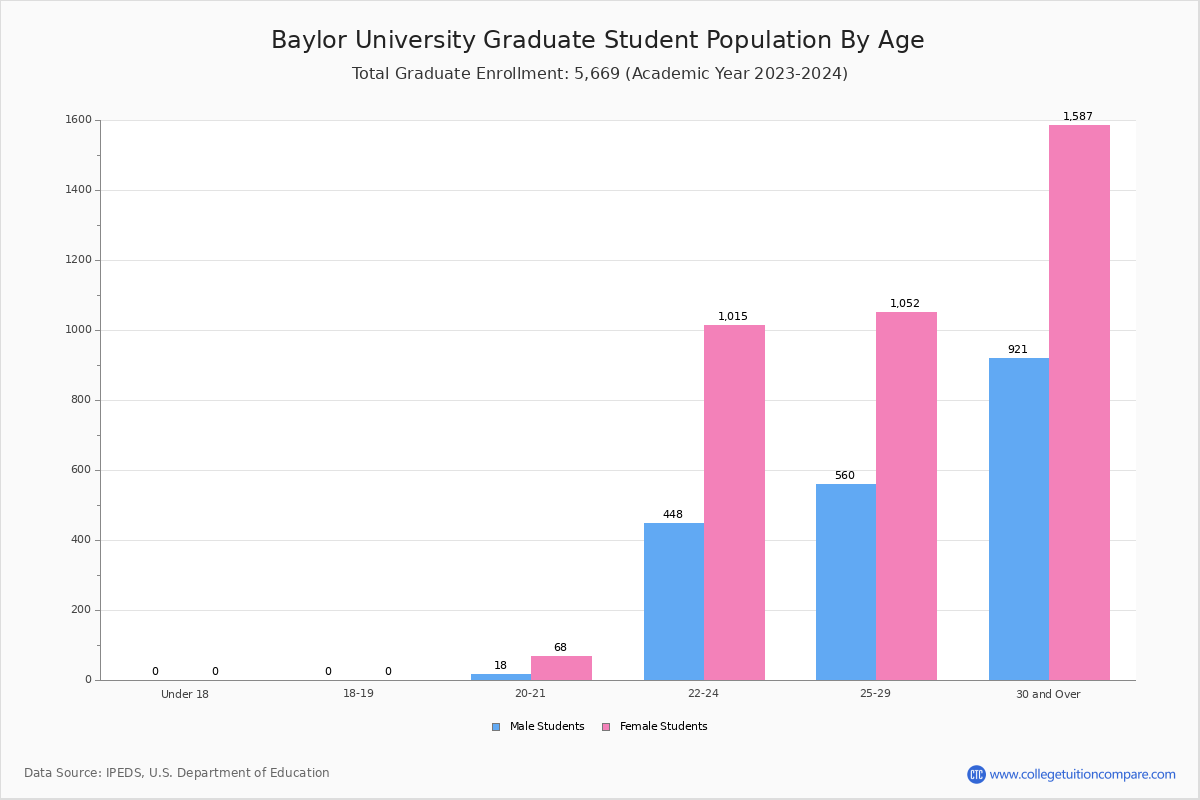
Student Age Distribution
By age, Baylor has 227 students under 18 years old and 19 students over 65 years old. There are 16,443 students under 25 years old, and 4,266 students over 25 years old out of 20,709 total students.
Baylor has 14,899 undergraduate students aged under 25 and 314 students aged 25 and over.
It has 1,544 graduate students aged under 25 and 3,952 students aged 25 and over.
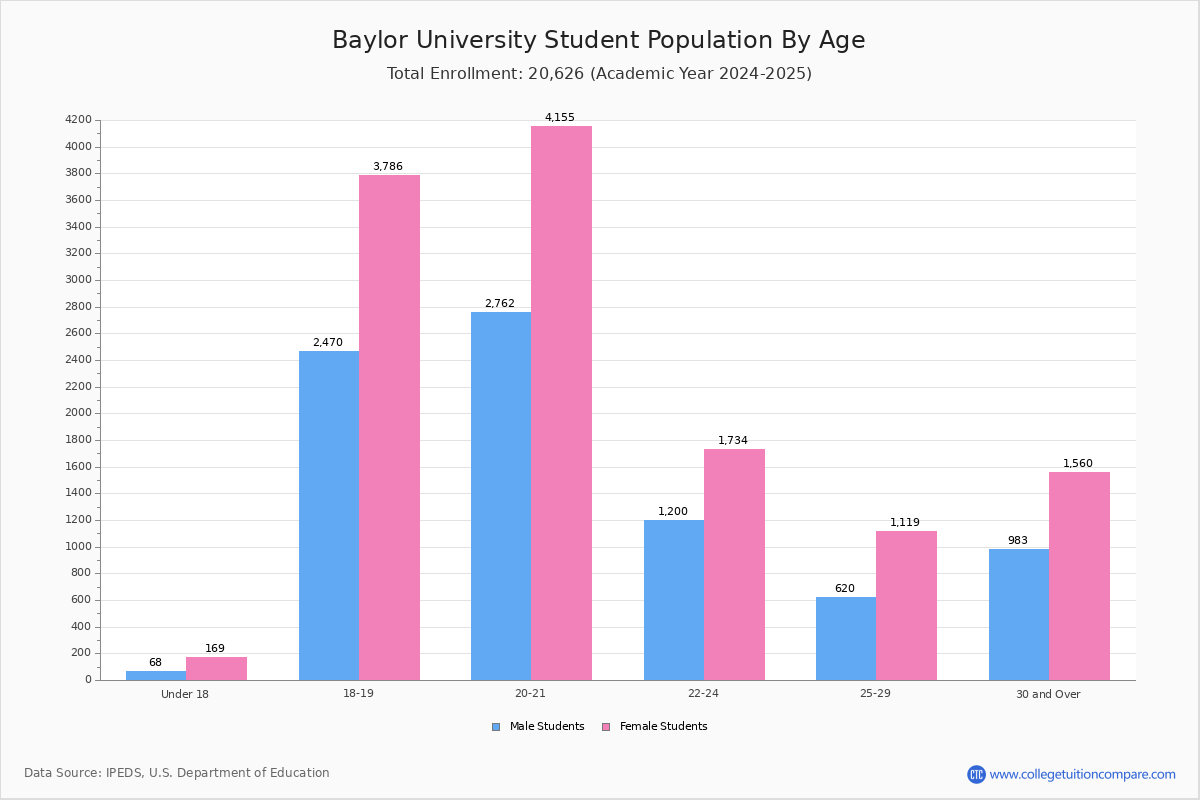


| Age | Total | Men | Women |
|---|---|---|---|
| Under 18 | 227 | 154 | 73 |
| 18-19 | 6,948 | 4,215 | 2,733 |
| 20-21 | 6,553 | 3,905 | 2,648 |
| 22-24 | 2,715 | 1,647 | 1,068 |
| 25-29 | 1,694 | 1,093 | 601 |
| 30-34 | 945 | 568 | 377 |
| 35-39 | 612 | 395 | 217 |
| 40-49 | 686 | 468 | 218 |
| 50-64 | 310 | 210 | 100 |
| Over 65 | 19 | 9 | 10 |
| Age | Total | Men | Women |
|---|---|---|---|
| Under 18 | 227 | 154 | 73 |
| 18-19 | 6,948 | 4,215 | 2,733 |
| 20-21 | 6,483 | 3,856 | 2,627 |
| 22-24 | 1,241 | 628 | 613 |
| 25-29 | 167 | 103 | 64 |
| 30-34 | 68 | 42 | 26 |
| 35-39 | 32 | 26 | 6 |
| 40-49 | 33 | 25 | 8 |
| 50-64 | 14 | 11 | 3 |
| Age | Total | Men | Women |
|---|
Online Student Enrollment
Distance learning, also called online education, is very attractive to students, especially who want to continue education and work in field. At Baylor University, 2,920 students are enrolled exclusively in online courses and 6,339 students are enrolled in some online courses.
1,395 students lived in Texas or jurisdiction in which the school is located are enrolled exclusively in online courses and 1,525 students live in other State or outside of the United States.

| All Students | Enrolled Exclusively Online Courses | Enrolled in Some Online Courses | |
|---|---|---|---|
| All Students | 20,709 | 2,920 | 6,339 |
| Undergraduate | 15,213 | 212 | 6,091 |
| Graduate | 5,496 | 2,708 | 248 |
| Texas Residents | Other States in U.S. | Outside of U.S. | |
|---|---|---|---|
| All Students | 1,395 | 1,520 | 5 |
| Undergraduate | 170 | 37 | 5 |
| Graduate | 1,225 | 1,483 | 0 |
Transfer-in Students (Undergraduate)
Among 15,213 enrolled in undergraduate programs, 367 students have transferred-in from other institutions. The percentage of transfer-in students is 2.41%.364 students have transferred in as full-time status and 3 students transferred in as part-time status.
| Number of Students | |
|---|---|
| Regular Full-time | 14,554 |
| Transfer-in Full-time | 364 |
| Regular Part-time | 292 |
| Transfer-in Part-time | 3 |