Student Population by Gender
Baptist Health Sciences University has a total of 797 enrolled students for the academic year 2022-2023. 777 students have enrolled in undergraduate programs and 20 students joined graduate programs.
By gender, 71 male and 726 female students (the male-female ratio is 9:91) are attending the school. The gender distribution is based on the 2022-2023 data.
| Total | Undergraduate | Graduate | |
|---|---|---|---|
| Total | 797 | 777 | 20 |
| Men | 71 | 67 | 4 |
| Women | 726 | 710 | 16 |
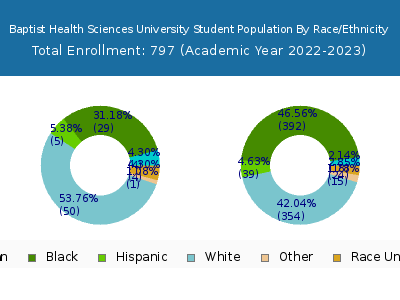
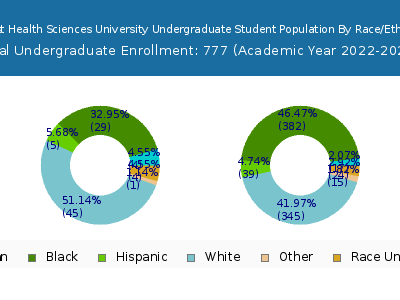
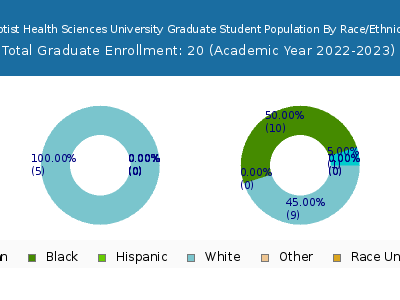
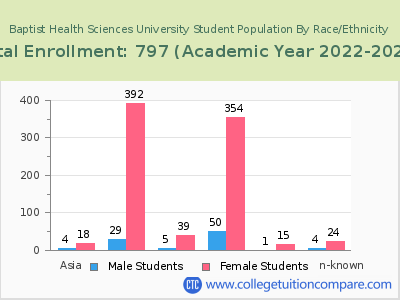
Student Distribution by Race/Ethnicity
| Race | Total | Men | Women |
|---|---|---|---|
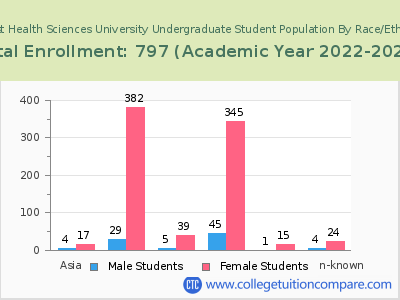
| American Indian or Native American | 5 | 0 | 5 |
| Asian | 19 | 2 | 17 |
| Black | 347 | 14 | 333 |
| Hispanic | 40 | 3 | 37 |
| Native Hawaiian or Other Pacific Islanders | 0 | 0 | 0 |
| White | 340 | 46 | 294 |
| Two or more races | 8 | 1 | 7 |
| Race Unknown | 38 | 5 | 33 |
| Race | Total | Men | Women |
|---|---|---|---|
| American Indian or Native American | 5 | 0 | 5 |
| Asian | 19 | 2 | 17 |
| Black | 342 | 14 | 328 |
| Hispanic | 39 | 3 | 36 |
| Native Hawaiian or Other Pacific Islanders | 0 | 0 | 0 |
| White | 327 | 42 | 285 |
| Two or more races | 8 | 1 | 7 |
| Race Unknown | 37 | 5 | 32 |
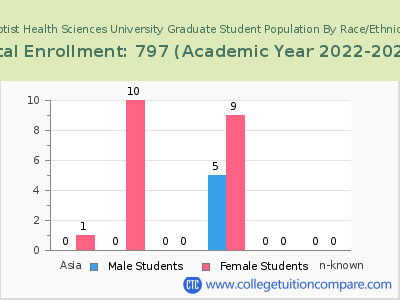
| Race | Total | Men | Women |
|---|---|---|---|
| American Indian or Native American | 1 | 0 | 1 |
| Asian | 2 | 0 | 2 |
| Black | 49 | 1 | 48 |
| Hispanic | 3 | 0 | 3 |
| Native Hawaiian or Other Pacific Islanders | 0 | 0 | 0 |
| White | 52 | 4 | 48 |
| Two or more races | 0 | 0 | 0 |
| Race Unknown | 8 | 1 | 7 |
Student Age Distribution
Online Student Enrollment
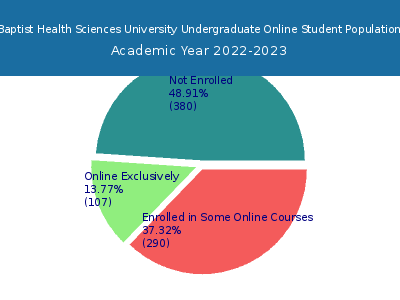
Distance learning, also called online education, is very attractive to students, especially who want to continue education and work in field. At Baptist Health Sciences University, 117 students are enrolled exclusively in online courses and 298 students are enrolled in some online courses.
80 students lived in Tennessee or jurisdiction in which the school is located are enrolled exclusively in online courses and 37 students live in other State or outside of the United States.
| All Students | Enrolled Exclusively Online Courses | Enrolled in Some Online Courses | |
|---|---|---|---|
| All Students | 797 | 117 | 298 |
| Undergraduate | 777 | 107 | 290 |
| Graduate | 20 | 10 | 8 |
| Tennessee Residents | Other States in U.S. | Outside of U.S. | |
|---|---|---|---|
| All Students | 80 | 37 | 0 |
| Undergraduate | 72 | 35 | 0 |
| Graduate | 8 | 2 | 0 |
Transfer-in Students (Undergraduate)
Among 777 enrolled in undergraduate programs, 115 students have transferred-in from other institutions. The percentage of transfer-in students is 14.80%.51 students have transferred in as full-time status and 64 students transferred in as part-time status.
| Number of Students | |
|---|---|
| Regular Full-time | 252 |
| Transfer-in Full-time | 51 |
| Regular Part-time | 410 |
| Transfer-in Part-time | 64 |
