Student Population by Gender
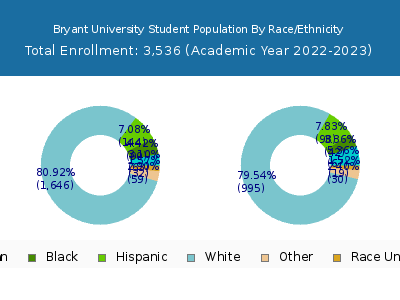
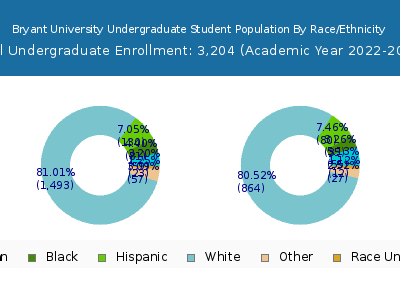
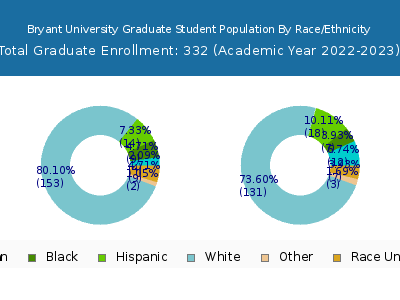
Bryant University has a total of 3,536 enrolled students for the academic year 2022-2023. 3,204 students have enrolled in undergraduate programs and 332 students joined graduate programs.
By gender, 2,210 male and 1,326 female students (the male-female ratio is 63:38) are attending the school. The gender distribution is based on the 2022-2023 data.
| Total | Undergraduate | Graduate | |
|---|---|---|---|
| Total | 3,536 | 3,204 | 332 |
| Men | 2,210 | 2,043 | 167 |
| Women | 1,326 | 1,161 | 165 |
Student Distribution by Race/Ethnicity
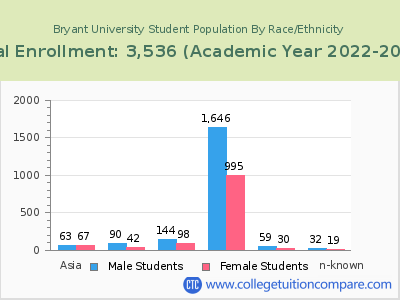
| Race | Total | Men | Women |
|---|---|---|---|
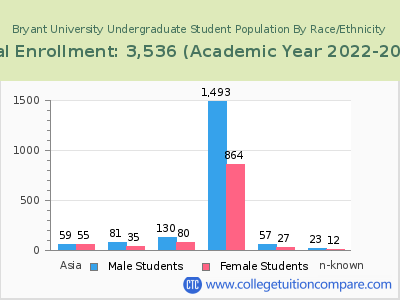
| American Indian or Native American | 5 | 4 | 1 |
| Asian | 131 | 68 | 63 |
| Black | 140 | 97 | 43 |
| Hispanic | 254 | 154 | 100 |
| Native Hawaiian or Other Pacific Islanders | 2 | 1 | 1 |
| White | 2,654 | 1,666 | 988 |
| Two or more races | 88 | 64 | 24 |
| Race Unknown | 85 | 58 | 27 |
| Race | Total | Men | Women |
|---|---|---|---|
| American Indian or Native American | 5 | 4 | 1 |
| Asian | 117 | 63 | 54 |
| Black | 129 | 90 | 39 |
| Hispanic | 230 | 143 | 87 |
| Native Hawaiian or Other Pacific Islanders | 2 | 1 | 1 |
| White | 2,413 | 1,545 | 868 |
| Two or more races | 84 | 60 | 24 |
| Race Unknown | 53 | 41 | 12 |
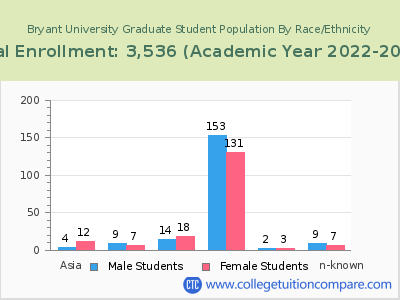
| Race | Total | Men | Women |
|---|---|---|---|
| American Indian or Native American | 0 | 0 | 0 |
| Asian | 3 | 2 | 1 |
| Black | 7 | 6 | 1 |
| Hispanic | 6 | 4 | 2 |
| Native Hawaiian or Other Pacific Islanders | 0 | 0 | 0 |
| White | 39 | 24 | 15 |
| Two or more races | 5 | 4 | 1 |
| Race Unknown | 5 | 4 | 1 |
Student Age Distribution
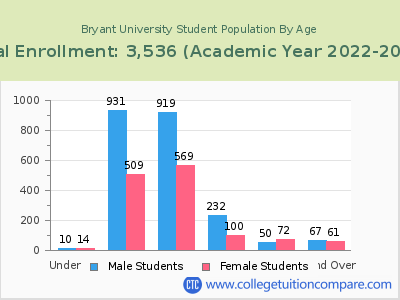
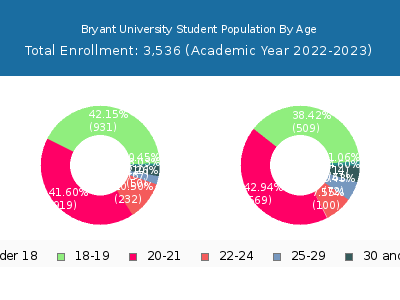
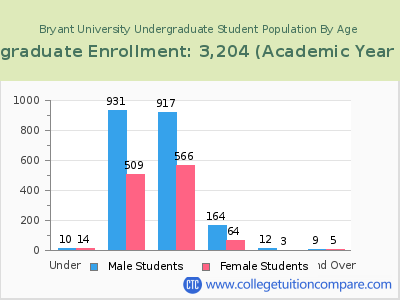
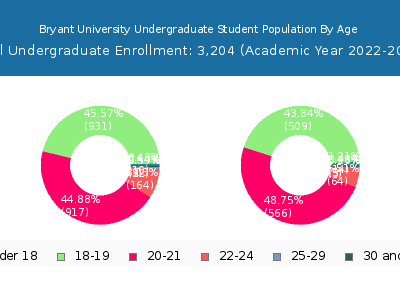
By age, Bryant has 24 students under 18 years old and 4 students over 65 years old. There are 3,284 students under 25 years old, and 250 students over 25 years old out of 3,536 total students.
Bryant has 3,175 undergraduate students aged under 25 and 29 students aged 25 and over.
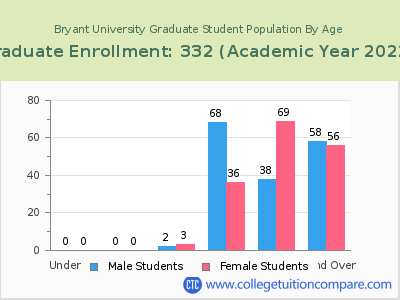
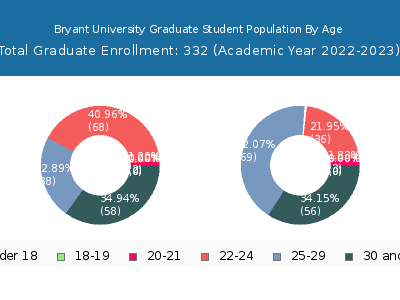
It has 109 graduate students aged under 25 and 221 students aged 25 and over.
| Age | Total | Men | Women |
|---|---|---|---|
| Under 18 | 24 | 14 | 10 |
| 18-19 | 1,440 | 509 | 931 |
| 20-21 | 1,488 | 569 | 919 |
| 22-24 | 332 | 100 | 232 |
| 25-29 | 122 | 72 | 50 |
| 30-34 | 51 | 22 | 29 |
| 35-39 | 31 | 14 | 17 |
| 40-49 | 29 | 17 | 12 |
| 50-64 | 13 | 5 | 8 |
| Over 65 | 4 | 3 | 1 |
| Age | Total | Men | Women |
|---|---|---|---|
| Under 18 | 24 | 14 | 10 |
| 18-19 | 1,440 | 509 | 931 |
| 20-21 | 1,483 | 566 | 917 |
| 22-24 | 228 | 64 | 164 |
| 25-29 | 15 | 3 | 12 |
| 30-34 | 7 | 3 | 4 |
| 35-39 | 6 | 2 | 4 |
| 40-49 | 1 | 0 | 1 |
| Age | Total | Men | Women |
|---|
Online Student Enrollment
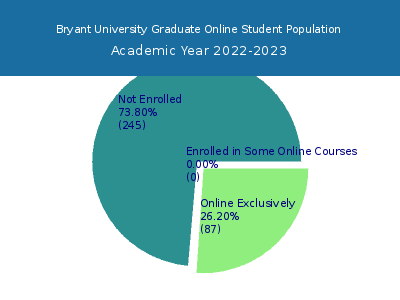
Distance learning, also called online education, is very attractive to students, especially who want to continue education and work in field. At Bryant University, 87 students are enrolled exclusively in online courses and 0 students are enrolled in some online courses.
40 students lived in Rhode Island or jurisdiction in which the school is located are enrolled exclusively in online courses and 47 students live in other State or outside of the United States.
| All Students | Enrolled Exclusively Online Courses | Enrolled in Some Online Courses | |
|---|---|---|---|
| All Students | 3,536 | 87 | 0 |
| Undergraduate | 3,204 | 0 | 0 |
| Graduate | 332 | 87 | 0 |
| Rhode Island Residents | Other States in U.S. | Outside of U.S. | |
|---|---|---|---|
| All Students | 40 | 47 | 0 |
| Undergraduate | 0 | - | 0 |
| Graduate | 40 | 47 | 0 |
Transfer-in Students (Undergraduate)
Among 3,204 enrolled in undergraduate programs, 78 students have transferred-in from other institutions. The percentage of transfer-in students is 2.43%.
| Number of Students | |
|---|---|
| Regular Full-time | 3,102 |
| Transfer-in Full-time | 78 |
