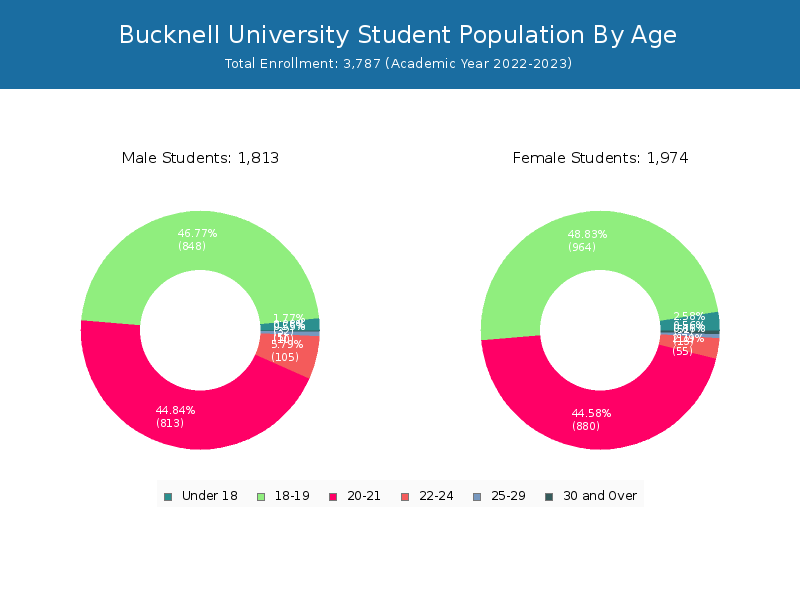
Student Population by Gender
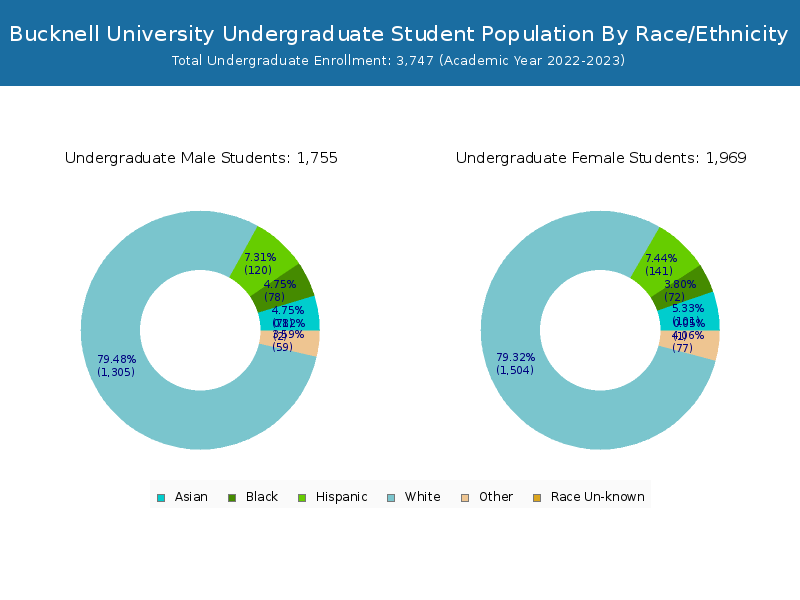
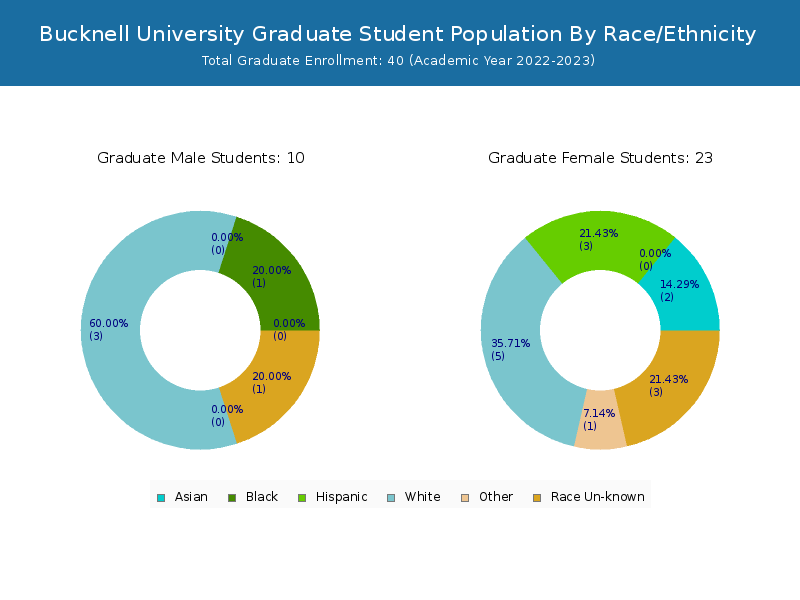
Bucknell University has a total of 3,787 enrolled students for the academic year 2022-2023. 3,747 students have enrolled in undergraduate programs and 40 students joined graduate programs.
By gender, 1,813 male and 1,974 female students (the male-female ratio is 48:52) are attending the school. The gender distribution is based on the 2022-2023 data.
| Total | Undergraduate | Graduate | |
|---|---|---|---|
| Total | 3,787 | 3,747 | 40 |
| Men | 1,813 | 1,797 | 16 |
| Women | 1,974 | 1,950 | 24 |
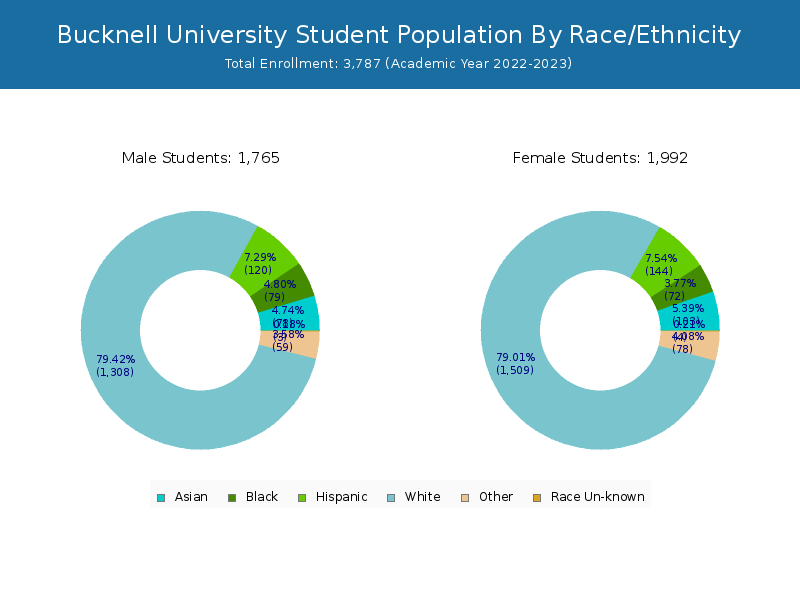
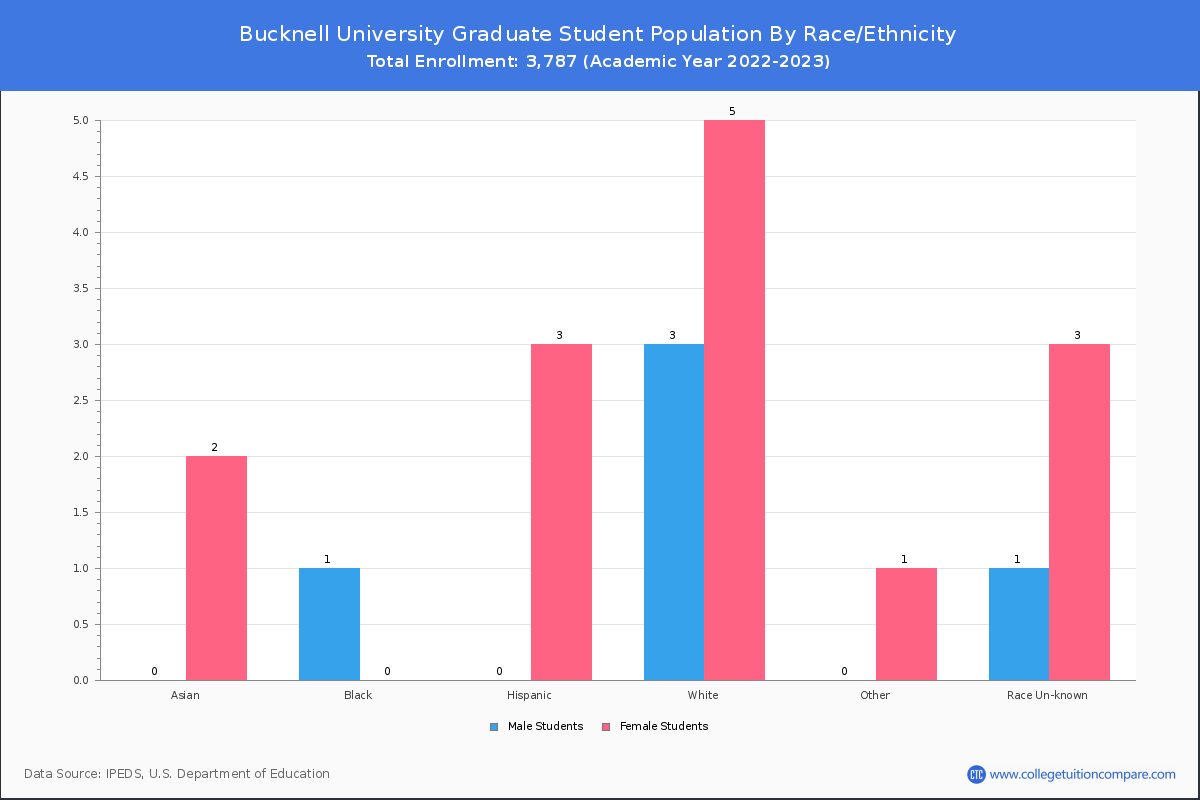
Student Distribution by Race/Ethnicity
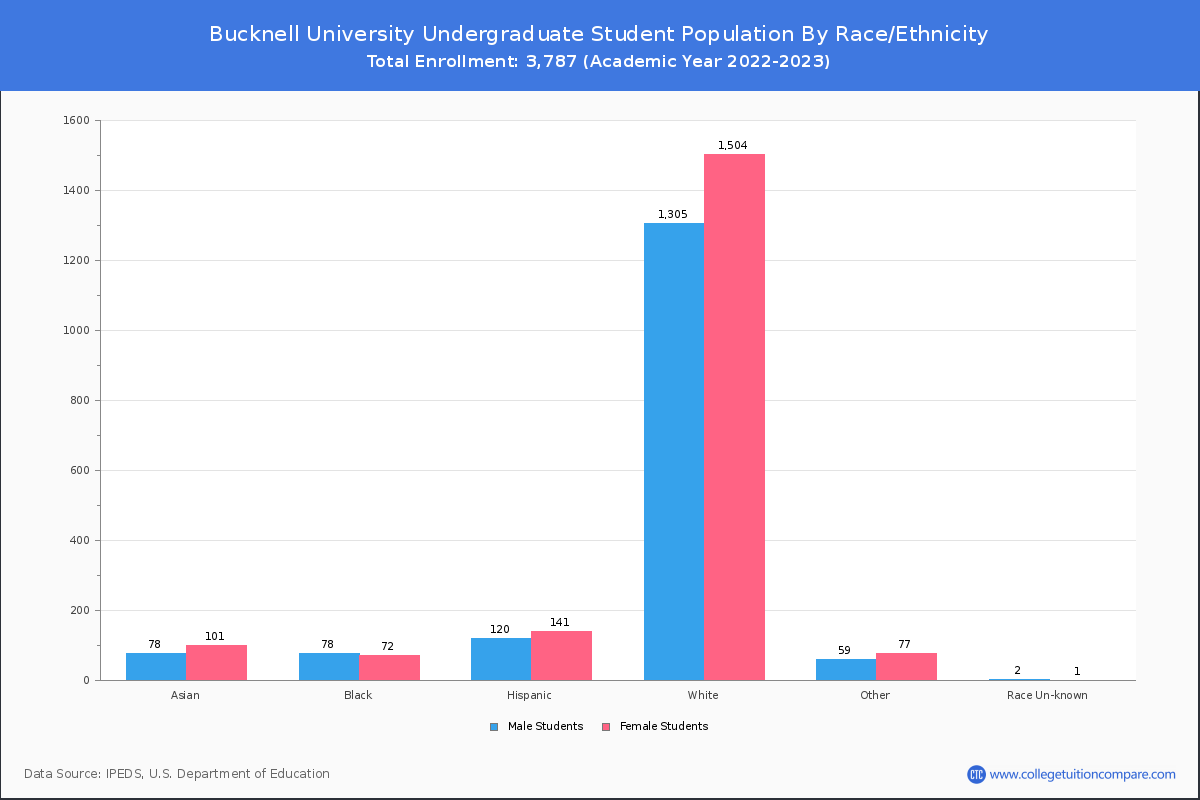
By race/ethnicity, 2,844 White, 154 Black, and 173 Asian students out of a total of 3,787 are attending at Bucknell University. Comprehensive enrollment statistic data by race/ethnicity is shown in the next chart (Academic year 2022-2023 data).

| Race | Total | Men | Women |
|---|---|---|---|
| American Indian or Native American | 1 | 0 | 1 |
| Asian | 173 | 74 | 99 |
| Black | 154 | 84 | 70 |
| Hispanic | 274 | 118 | 156 |
| Native Hawaiian or Other Pacific Islanders | 2 | 2 | 0 |
| White | 2,844 | 1,359 | 1,485 |
| Two or more races | 138 | 58 | 80 |
| Race Unknown | 6 | 1 | 5 |
| Race | Total | Men | Women |
|---|---|---|---|
| American Indian or Native American | 1 | 0 | 1 |
| Asian | 170 | 73 | 97 |
| Black | 154 | 84 | 70 |
| Hispanic | 272 | 118 | 154 |
| Native Hawaiian or Other Pacific Islanders | 2 | 2 | 0 |
| White | 2,829 | 1,350 | 1,479 |
| Two or more races | 138 | 58 | 80 |
| Race Unknown | 3 | 1 | 2 |
| Race | Total | Men | Women |
|---|---|---|---|
| American Indian or Native American | 0 | 0 | 0 |
| Asian | 0 | 0 | 0 |
| Black | 0 | 0 | 0 |
| Hispanic | 1 | 0 | 1 |
| Native Hawaiian or Other Pacific Islanders | 0 | 0 | 0 |
| White | 15 | 9 | 6 |
| Two or more races | 1 | 0 | 1 |
| Race Unknown | 0 | 0 | 0 |
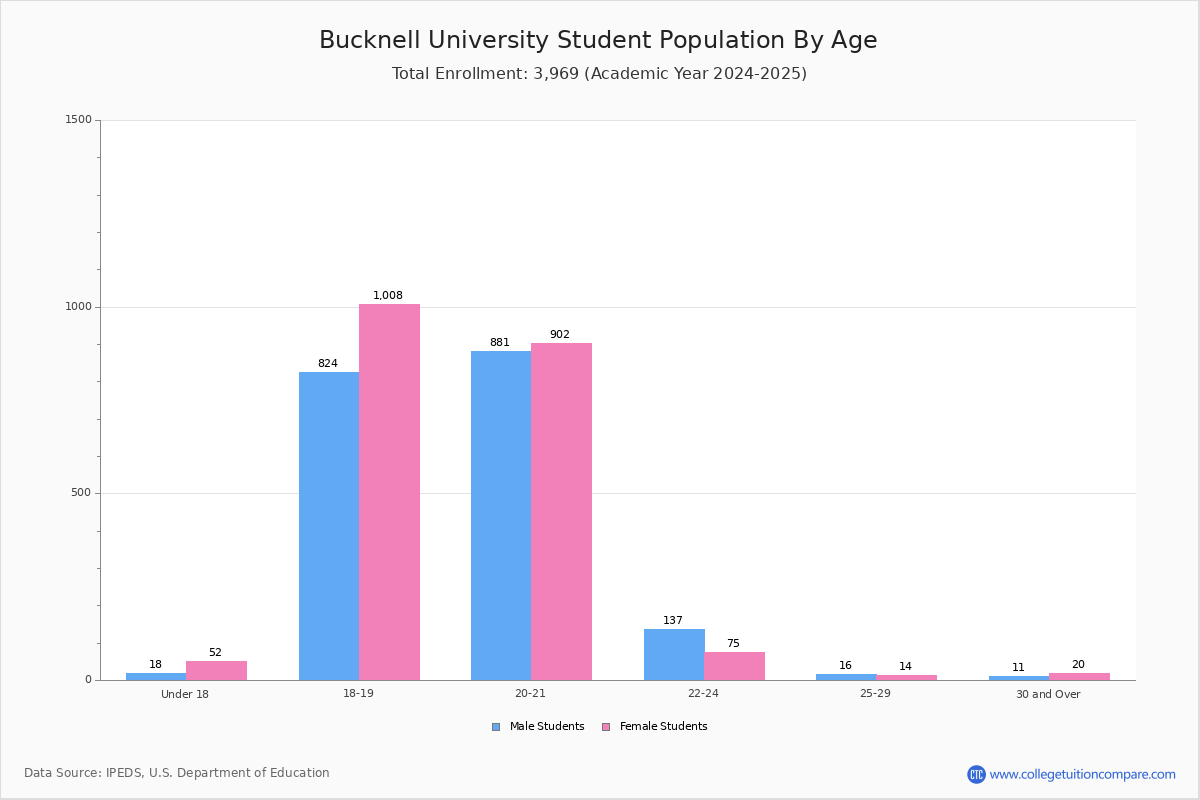
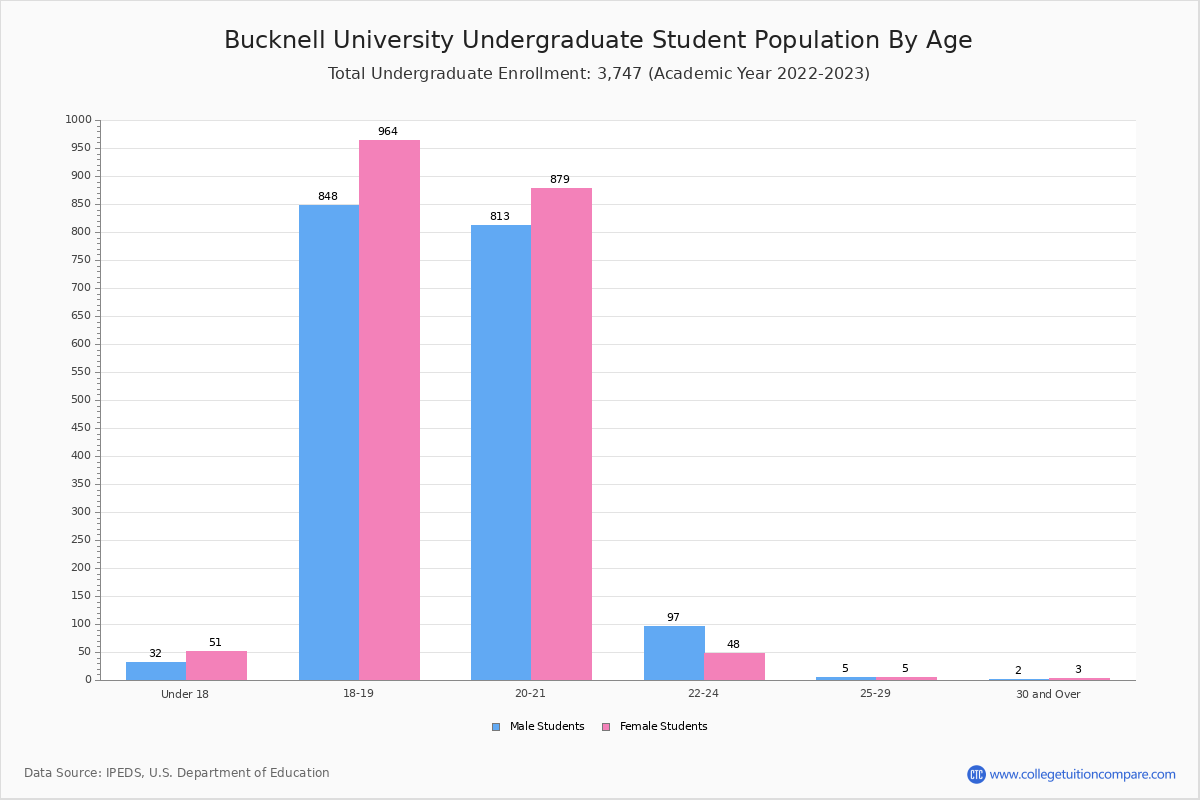
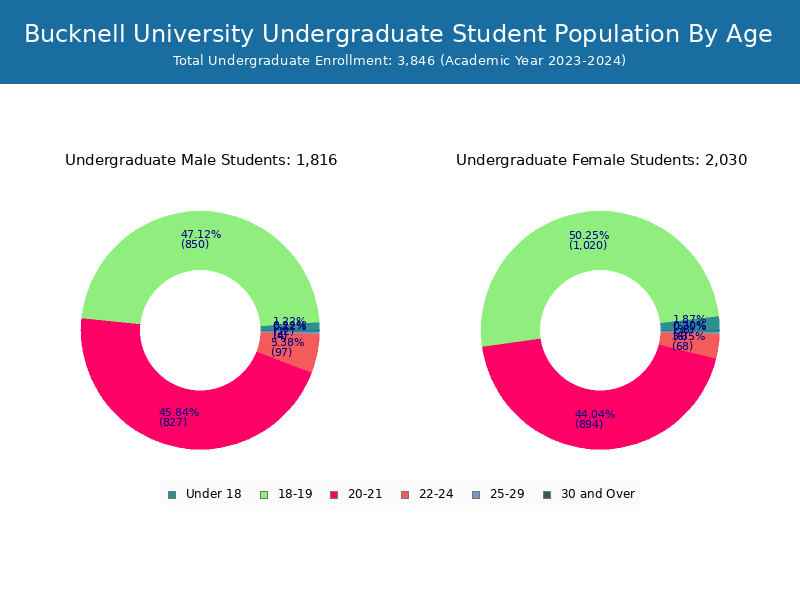
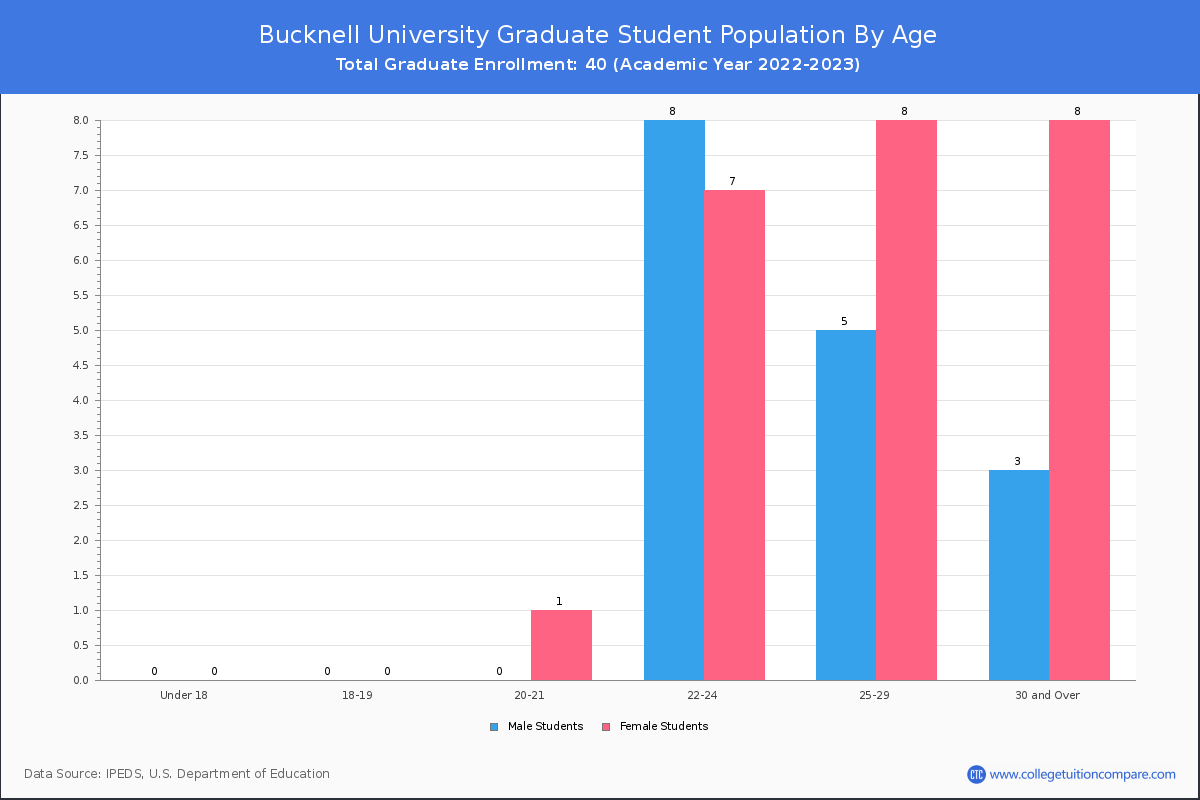
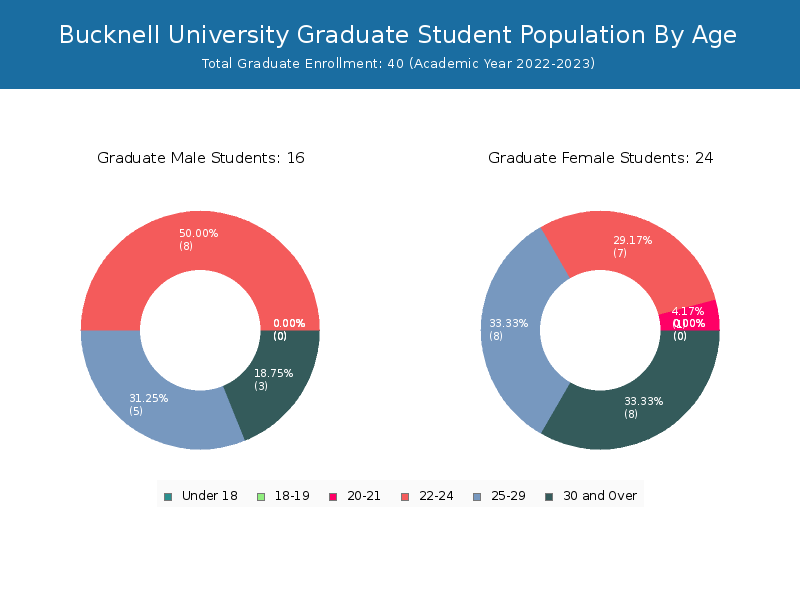
Student Age Distribution
There are 3,748 students under 25 years old, and 39 students over 25 years old out of 3,787 total students.
Bucknell has 3,732 undergraduate students aged under 25 and 15 students aged 25 and over.
It has 16 graduate students aged under 25 and 24 students aged 25 and over.
| Age | Total | Men | Women |
|---|---|---|---|
| Under 18 | 83 | 51 | 32 |
| 18-19 | 1,812 | 964 | 848 |
| 20-21 | 1,693 | 880 | 813 |
| 22-24 | 160 | 55 | 105 |
| 25-29 | 23 | 13 | 10 |
| 30-34 | 11 | 7 | 4 |
| 35-39 | 4 | 4 | 0 |
| 40-49 | 1 | 0 | 1 |
| Age | Total | Men | Women |
|---|---|---|---|
| Under 18 | 83 | 51 | 32 |
| 18-19 | 1,812 | 964 | 848 |
| 20-21 | 1,692 | 879 | 813 |
| 22-24 | 145 | 48 | 97 |
| 25-29 | 10 | 5 | 5 |
| 30-34 | 4 | 2 | 2 |
| 35-39 | 1 | 1 | 0 |
| Age | Total | Men | Women |
|---|
Transfer-in Students (Undergraduate)
Among 3,747 enrolled in undergraduate programs, 18 students have transferred-in from other institutions. The percentage of transfer-in students is 0.48%.
| Number of Students | |
|---|---|
| Regular Full-time | 3,715 |
| Transfer-in Full-time | 18 |