Student Population by Gender
Ohio State University-Main Campus has a total of 60,540 enrolled students for the academic year 2022-2023. 46,123 students have enrolled in undergraduate programs and 14,417 students joined graduate programs.
By gender, 29,012 male and 31,528 female students (the male-female ratio is 48:52) are attending the school. The gender distribution is based on the 2022-2023 data.
| Total | Undergraduate | Graduate | |
|---|---|---|---|
| Total | 60,540 | 46,123 | 14,417 |
| Men | 29,012 | 23,014 | 5,998 |
| Women | 31,528 | 23,109 | 8,419 |
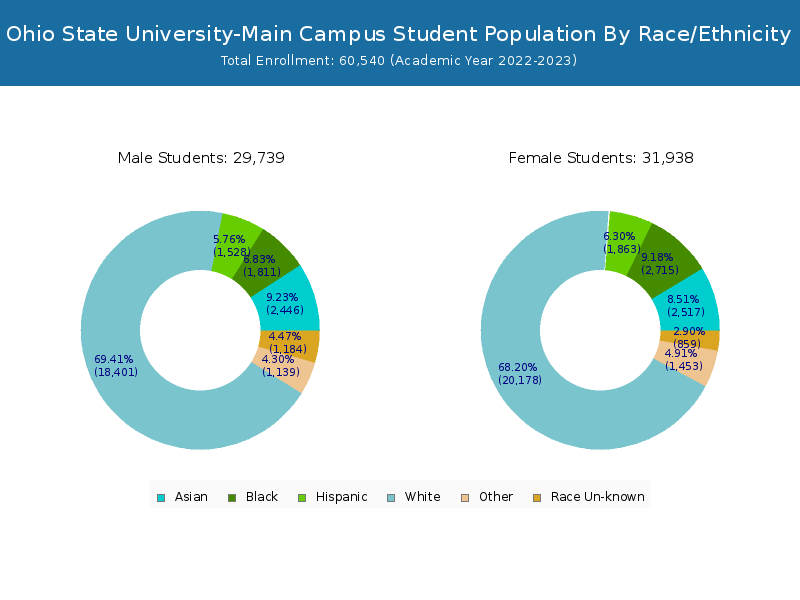
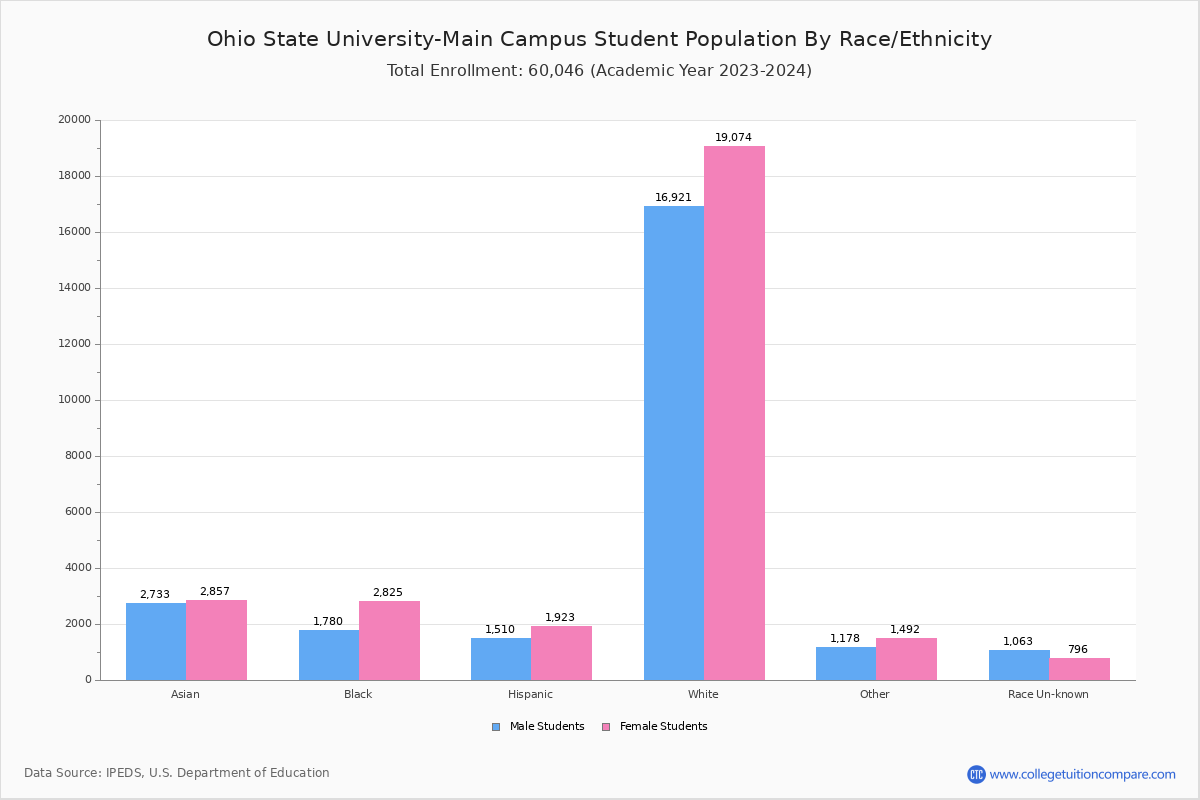
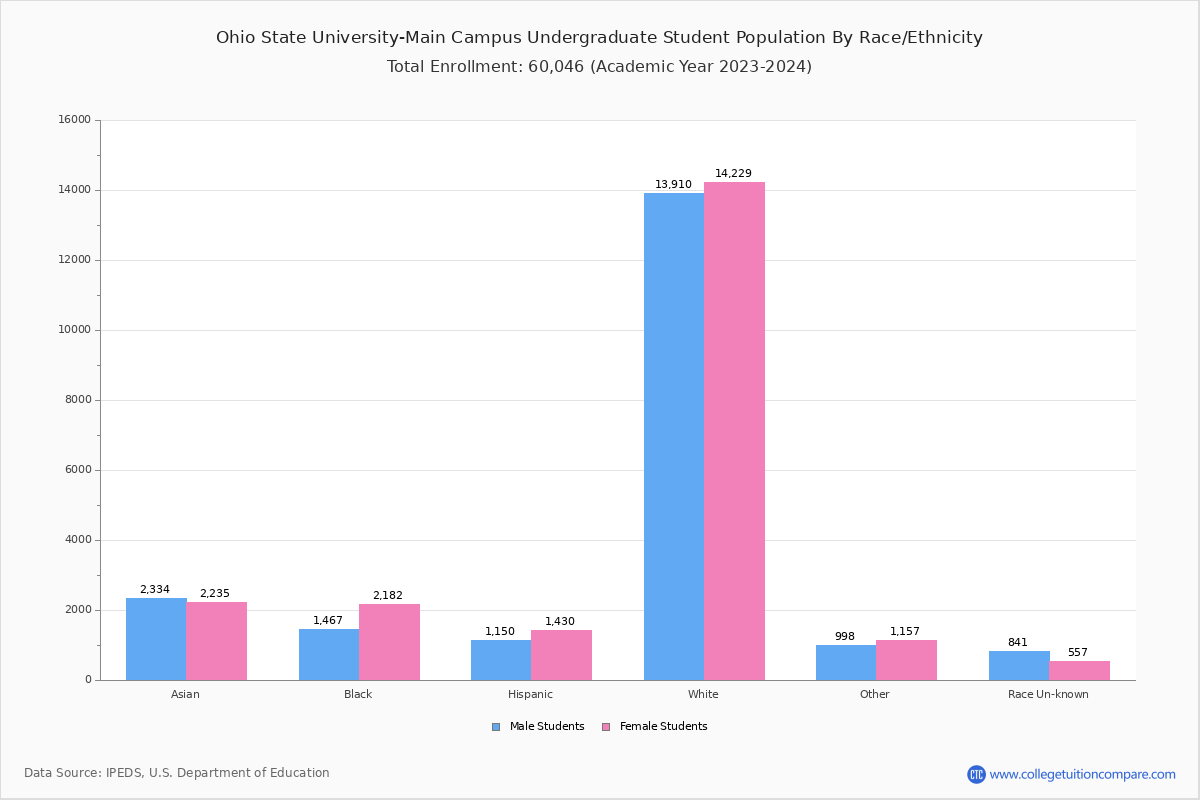
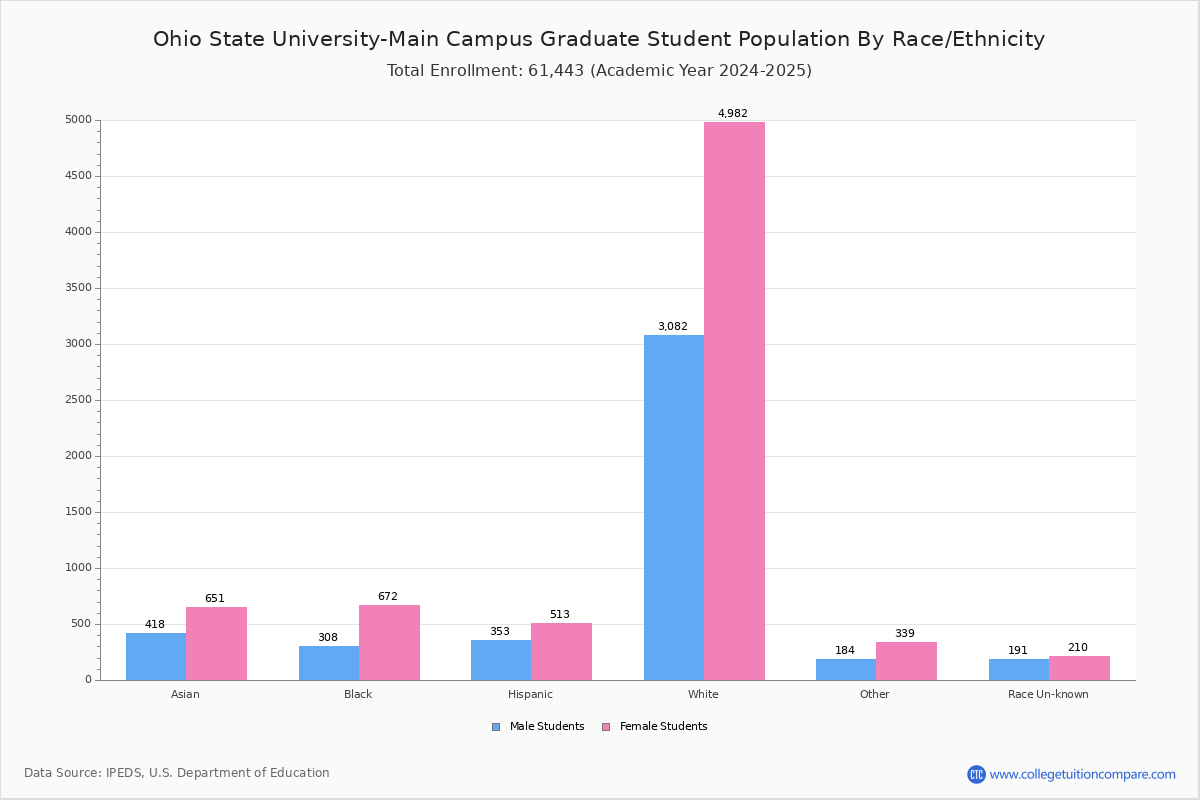
Student Distribution by Race/Ethnicity
By race/ethnicity, 36,982 White, 4,544 Black, and 5,204 Asian students out of a total of 60,540 are attending at Ohio State University-Main Campus. Comprehensive enrollment statistic data by race/ethnicity is shown in the next chart (Academic year 2022-2023 data).
| Race | Total | Men | Women |
|---|---|---|---|
| American Indian or Native American | 34 | 11 | 23 |
| Asian | 5,204 | 2,545 | 2,659 |
| Black | 4,544 | 1,792 | 2,752 |
| Hispanic | 3,383 | 1,518 | 1,865 |
| Native Hawaiian or Other Pacific Islanders | 25 | 16 | 9 |
| White | 36,982 | 17,470 | 19,512 |
| Two or more races | 2,549 | 1,118 | 1,431 |
| Race Unknown | 2,016 | 1,129 | 887 |
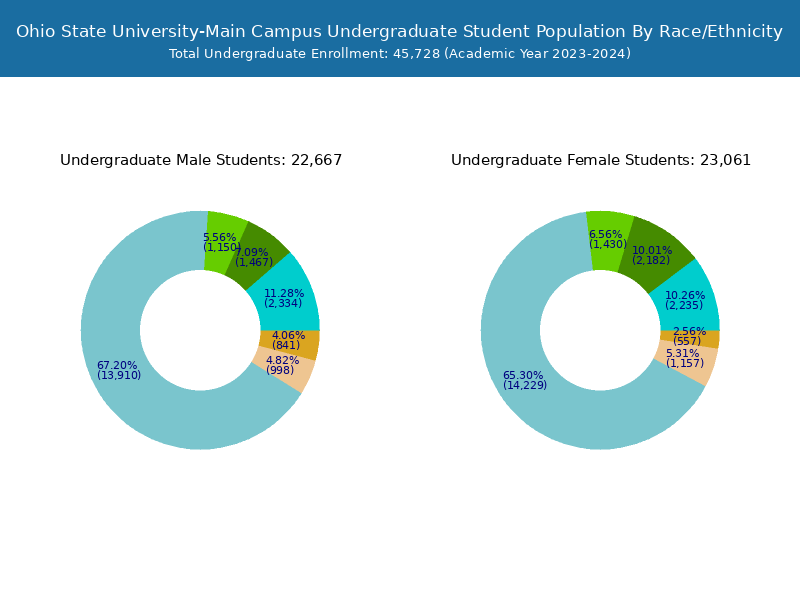
| Race | Total | Men | Women |
|---|---|---|---|
| American Indian or Native American | 23 | 8 | 15 |
| Asian | 4,255 | 2,167 | 2,088 |
| Black | 3,608 | 1,495 | 2,113 |
| Hispanic | 2,473 | 1,139 | 1,334 |
| Native Hawaiian or Other Pacific Islanders | 23 | 16 | 7 |
| White | 29,059 | 14,478 | 14,581 |
| Two or more races | 2,063 | 941 | 1,122 |
| Race Unknown | 1,419 | 829 | 590 |
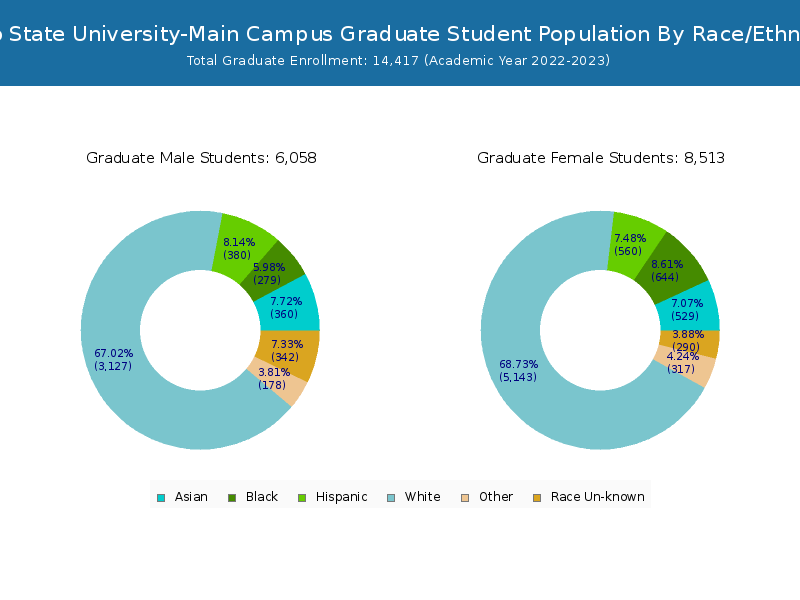
| Race | Total | Men | Women |
|---|---|---|---|
| American Indian or Native American | 2 | 1 | 1 |
| Asian | 218 | 122 | 96 |
| Black | 380 | 182 | 198 |
| Hispanic | 201 | 89 | 112 |
| Native Hawaiian or Other Pacific Islanders | 1 | 1 | 0 |
| White | 2,231 | 1,225 | 1,006 |
| Two or more races | 181 | 83 | 98 |
| Race Unknown | 106 | 59 | 47 |
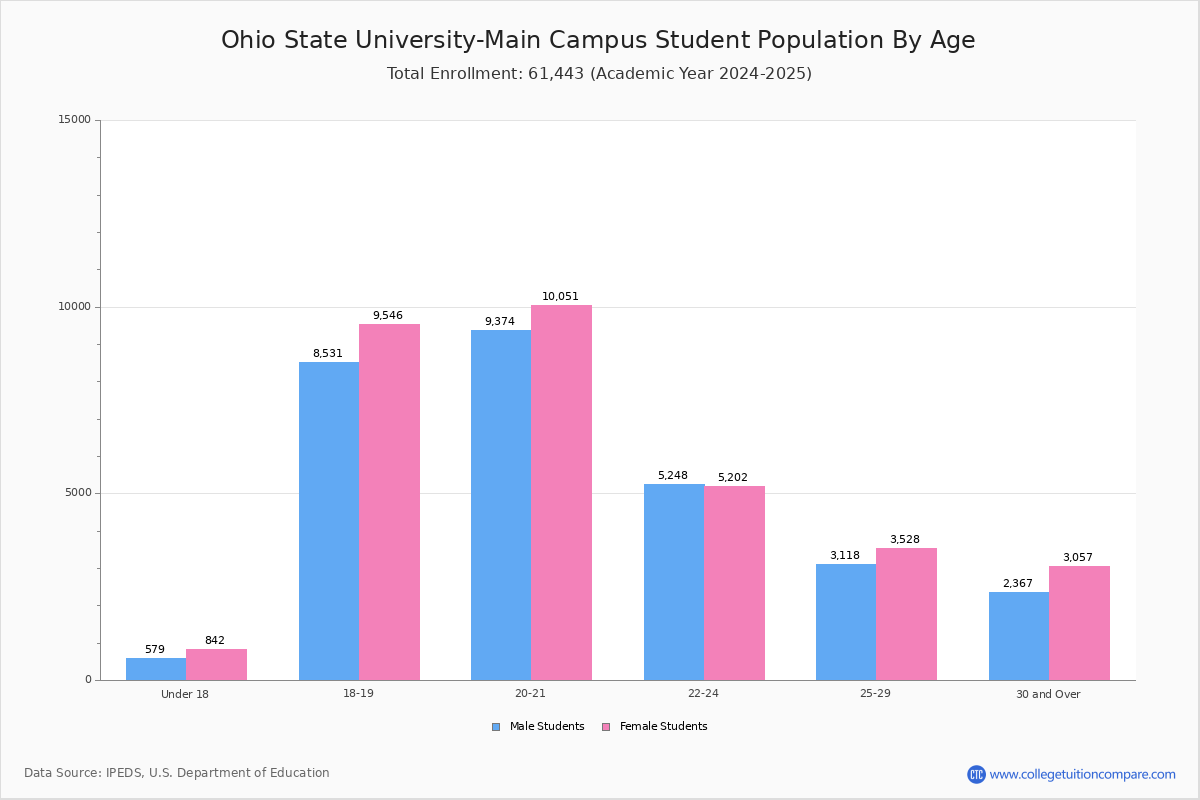
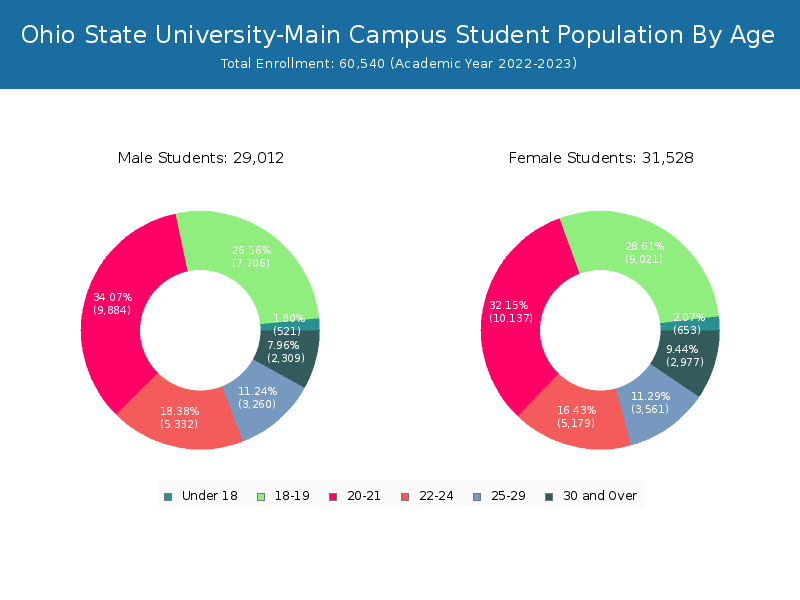
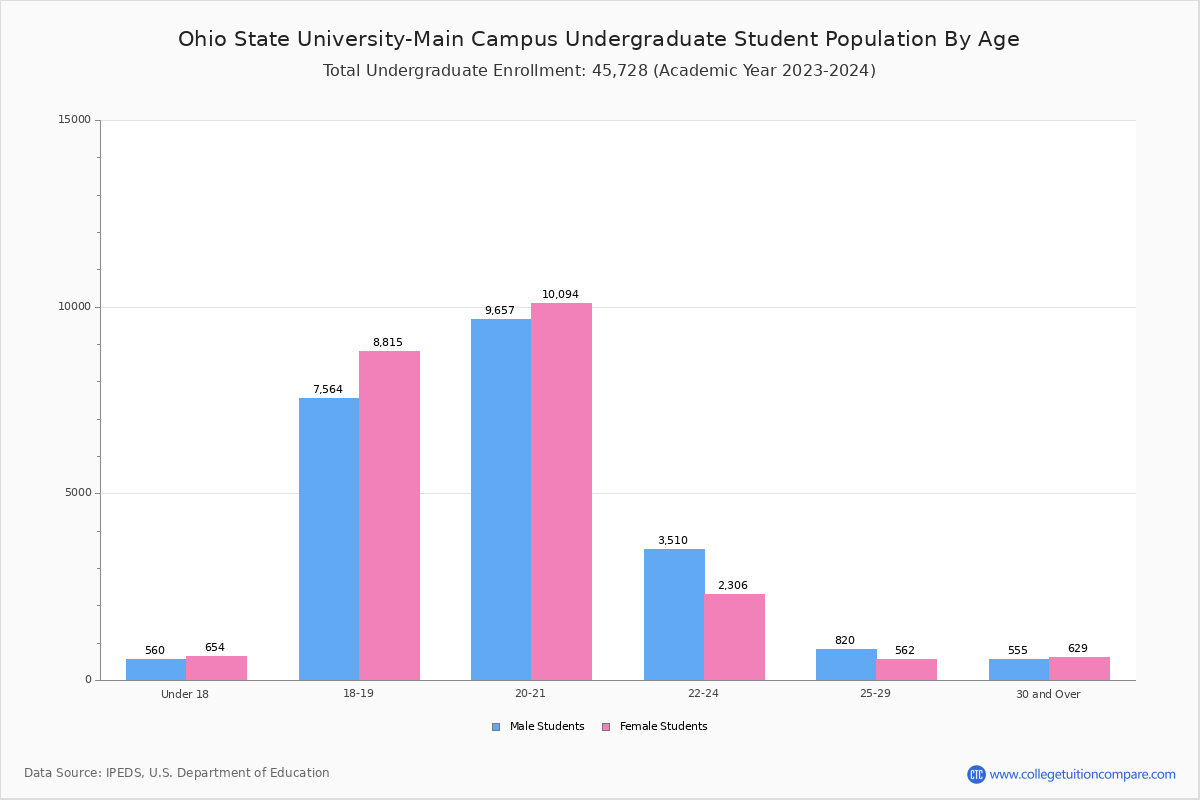
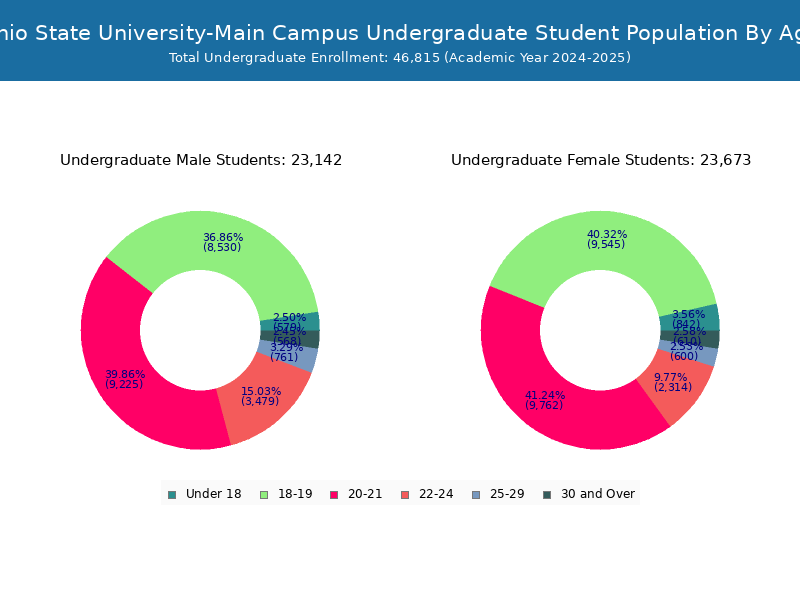
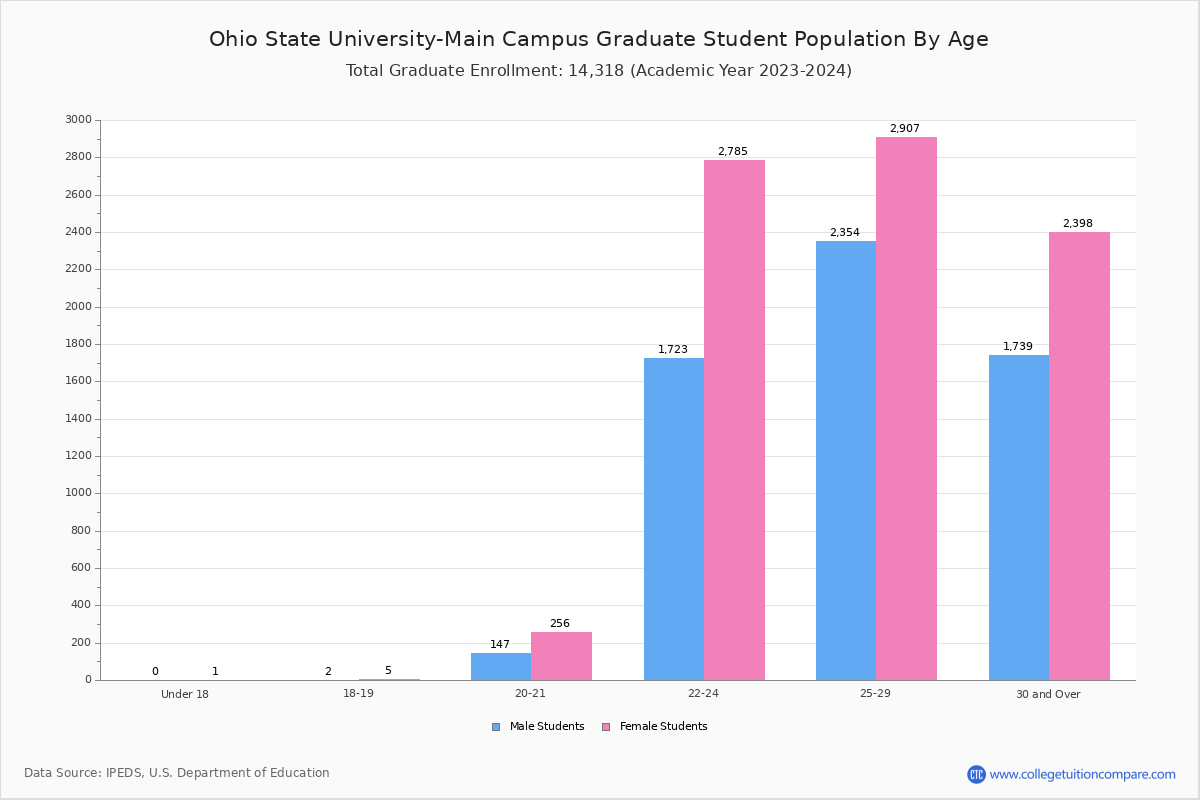
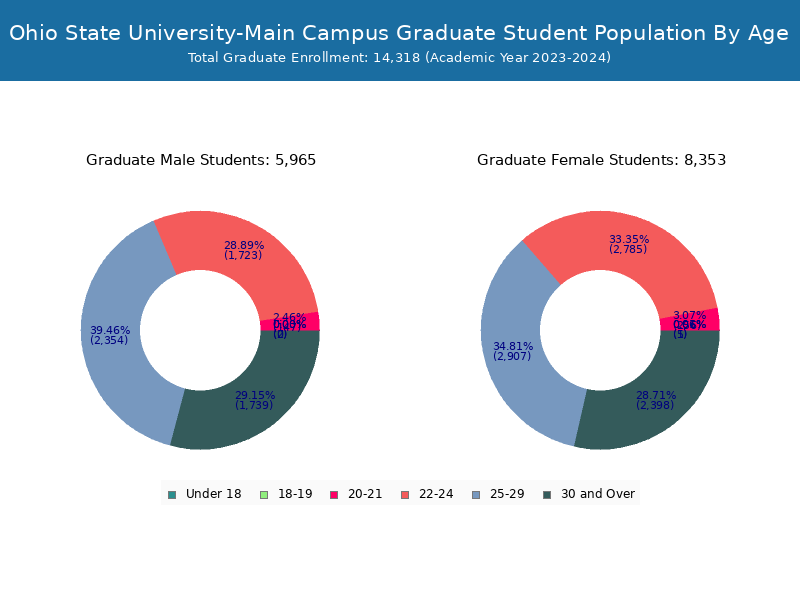
Student Age Distribution
By age, OSU has 1,174 students under 18 years old and 34 students over 65 years old. There are 48,433 students under 25 years old, and 12,107 students over 25 years old out of 60,540 total students.
In undergraduate programs, 1,174 students are younger than 18 and 14 students are older than 65. OSU has 43,492 undergraduate students aged under 25 and 2,631 students aged 25 and over.
It has 4,941 graduate students aged under 25 and 9,476 students aged 25 and over.
| Age | Total | Men | Women |
|---|---|---|---|
| Under 18 | 1,174 | 653 | 521 |
| 18-19 | 16,727 | 9,021 | 7,706 |
| 20-21 | 20,021 | 10,137 | 9,884 |
| 22-24 | 10,511 | 5,179 | 5,332 |
| 25-29 | 6,821 | 3,561 | 3,260 |
| 30-34 | 2,448 | 1,248 | 1,200 |
| 35-39 | 1,156 | 666 | 490 |
| 40-49 | 1,135 | 709 | 426 |
| 50-64 | 513 | 339 | 174 |
| Over 65 | 34 | 15 | 19 |
| Age | Total | Men | Women |
|---|---|---|---|
| Under 18 | 1,174 | 653 | 521 |
| 18-19 | 16,725 | 9,020 | 7,705 |
| 20-21 | 19,665 | 9,916 | 9,749 |
| 22-24 | 5,928 | 2,321 | 3,607 |
| 25-29 | 1,409 | 560 | 849 |
| 30-34 | 536 | 240 | 296 |
| 35-39 | 261 | 139 | 122 |
| 40-49 | 271 | 174 | 97 |
| 50-64 | 140 | 82 | 58 |
| Over 65 | 14 | 4 | 10 |
| Age | Total | Men | Women |
|---|
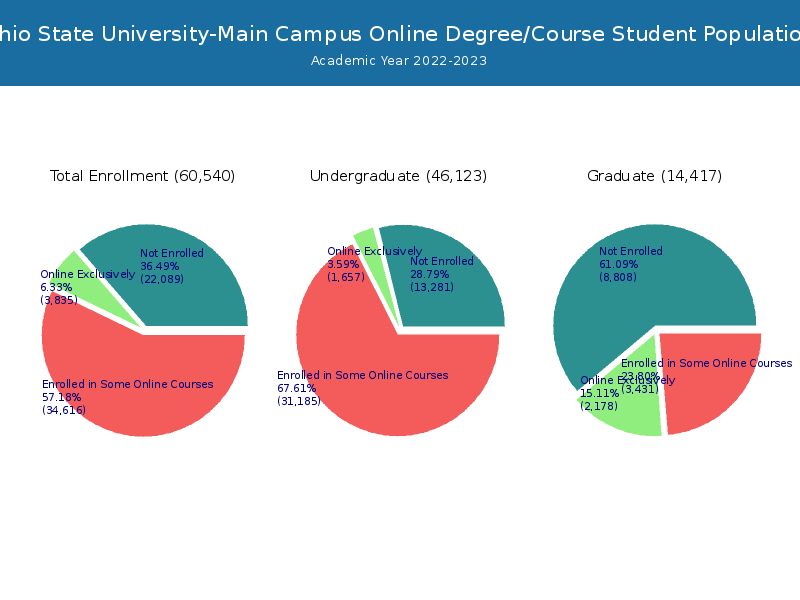
Online Student Enrollment
Distance learning, also called online education, is very attractive to students, especially who want to continue education and work in field. At Ohio State University-Main Campus, 3,835 students are enrolled exclusively in online courses and 34,616 students are enrolled in some online courses.
3,029 students lived in Ohio or jurisdiction in which the school is located are enrolled exclusively in online courses and 806 students live in other State or outside of the United States.
| All Students | Enrolled Exclusively Online Courses | Enrolled in Some Online Courses | |
|---|---|---|---|
| All Students | 60,540 | 3,835 | 34,616 |
| Undergraduate | 46,123 | 1,657 | 31,185 |
| Graduate | 14,417 | 2,178 | 3,431 |
| Ohio Residents | Other States in U.S. | Outside of U.S. | |
|---|---|---|---|
| All Students | 3,029 | 738 | 68 |
| Undergraduate | 1,382 | 239 | 36 |
| Graduate | 1,647 | 499 | 32 |
Transfer-in Students (Undergraduate)
Among 46,123 enrolled in undergraduate programs, 3,461 students have transferred-in from other institutions. The percentage of transfer-in students is 7.50%.3,145 students have transferred in as full-time status and 316 students transferred in as part-time status.
| Number of Students | |
|---|---|
| Regular Full-time | 39,215 |
| Transfer-in Full-time | 3,145 |
| Regular Part-time | 3,447 |
| Transfer-in Part-time | 316 |