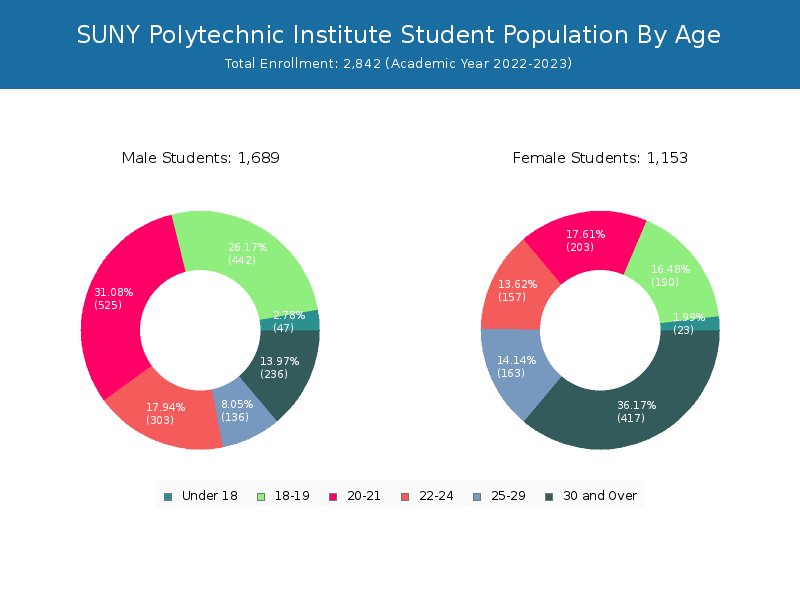
Student Population by Gender
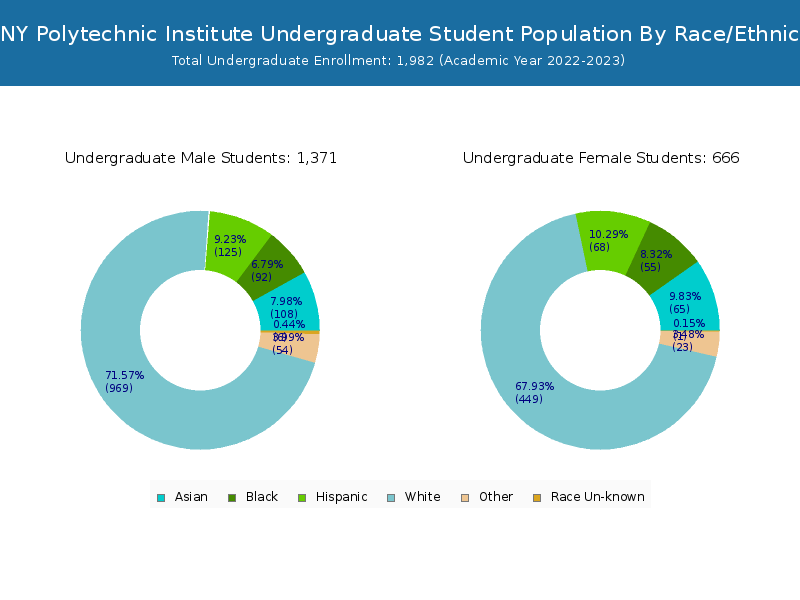
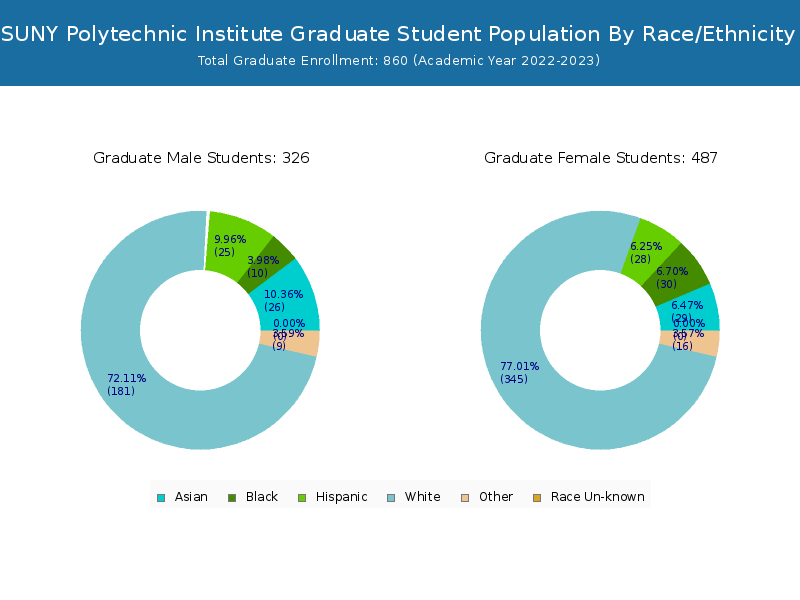
SUNY Polytechnic Institute has a total of 2,842 enrolled students for the academic year 2022-2023. 1,982 students have enrolled in undergraduate programs and 860 students joined graduate programs.
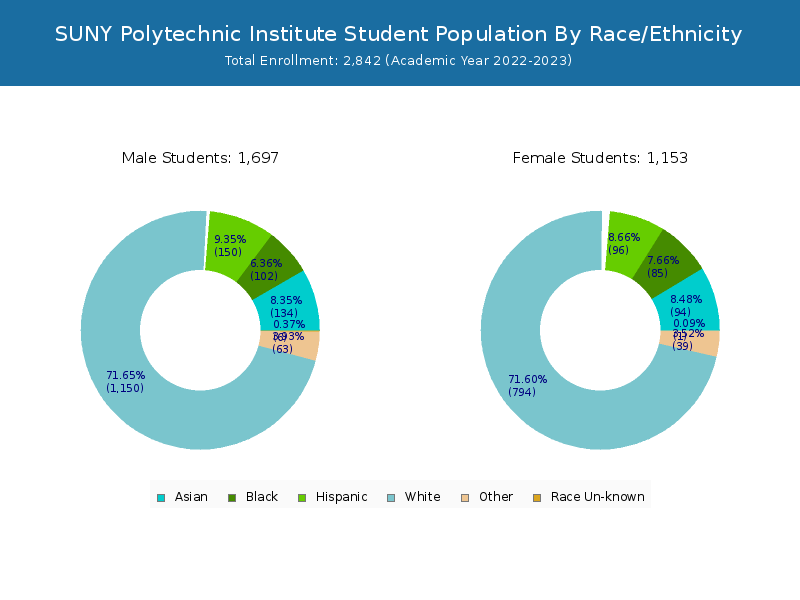
By gender, 1,689 male and 1,153 female students (the male-female ratio is 59:41) are attending the school. The gender distribution is based on the 2022-2023 data.
| Total | Undergraduate | Graduate | |
|---|---|---|---|
| Total | 2,842 | 1,982 | 860 |
| Men | 1,689 | 1,342 | 347 |
| Women | 1,153 | 640 | 513 |
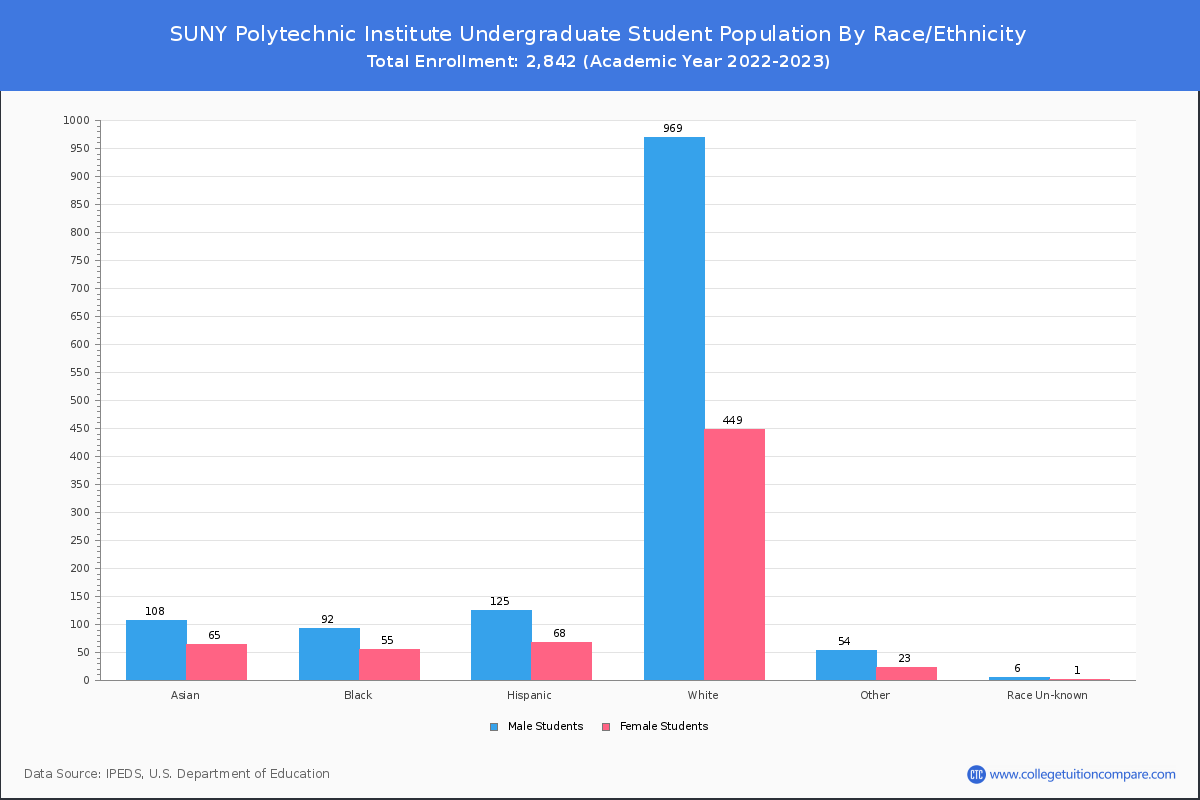
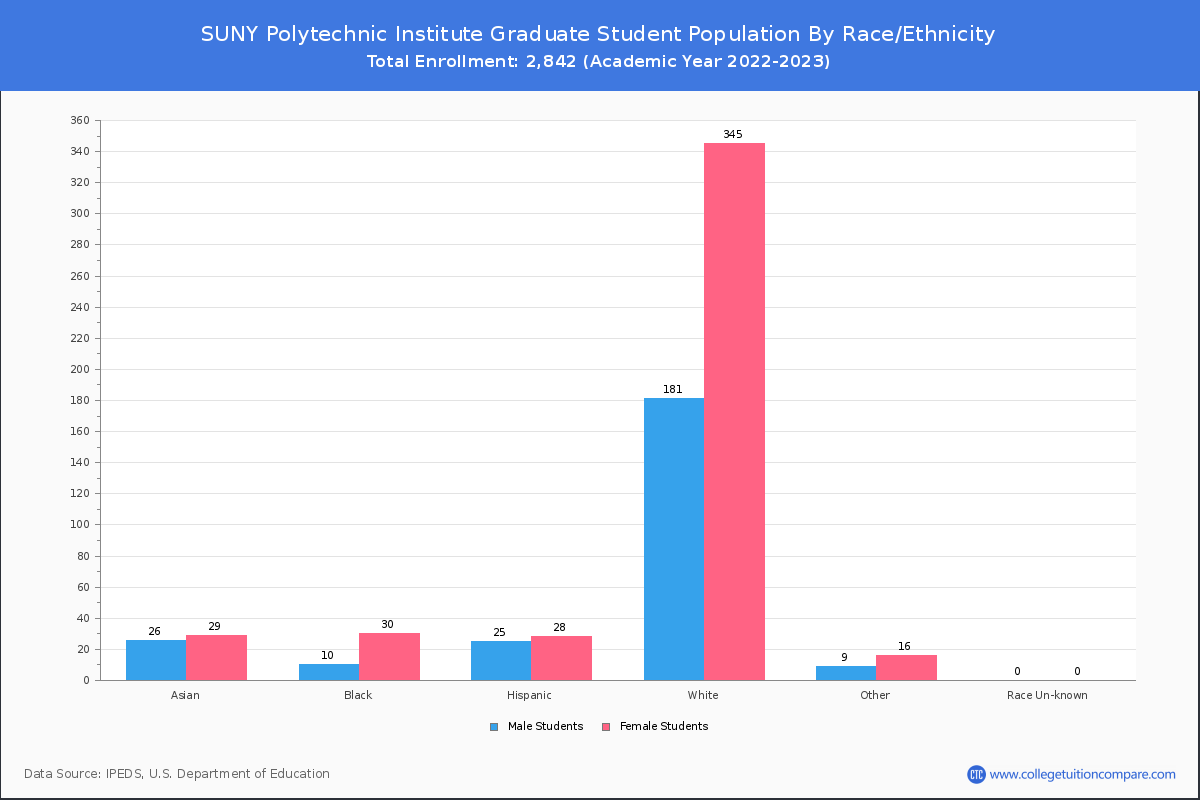
Student Distribution by Race/Ethnicity
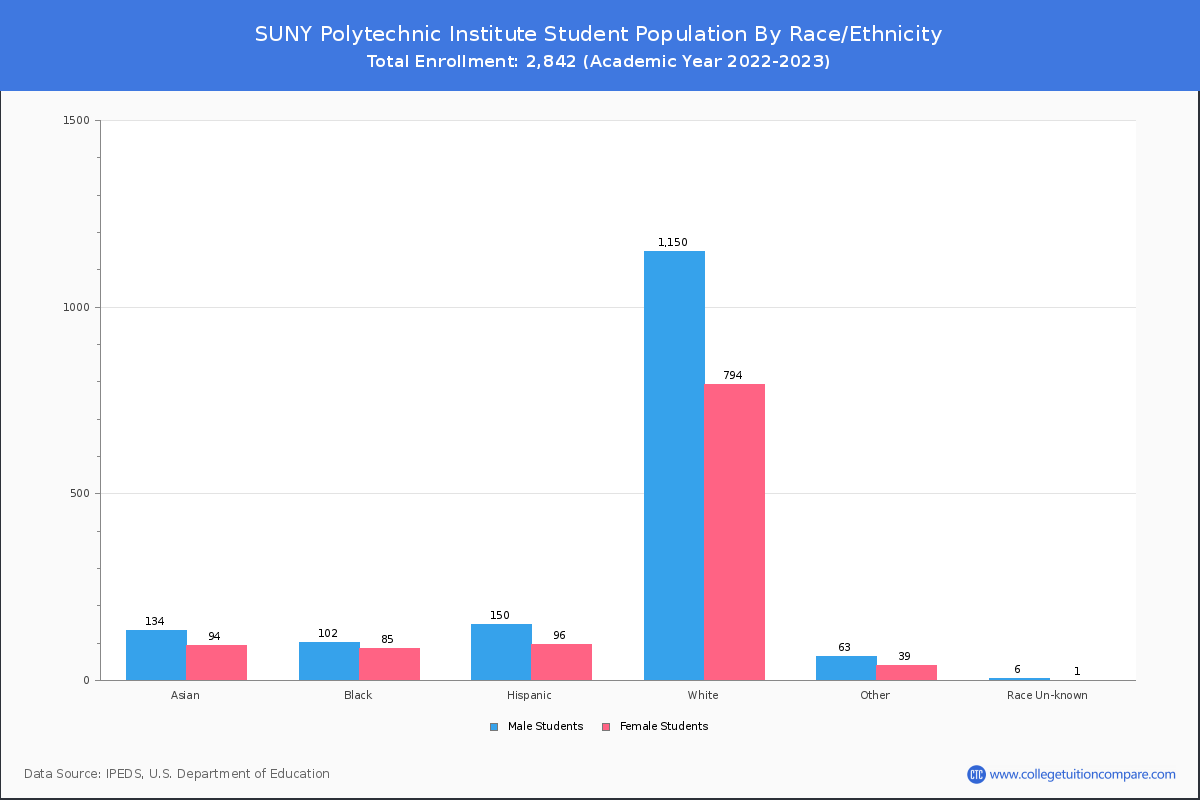
By race/ethnicity, 1,868 White, 205 Black, and 221 Asian students out of a total of 2,842 are attending at SUNY Polytechnic Institute. Comprehensive enrollment statistic data by race/ethnicity is shown in the next chart (Academic year 2022-2023 data).
| Race | Total | Men | Women |
|---|---|---|---|
| American Indian or Native American | 11 | 5 | 6 |
| Asian | 221 | 126 | 95 |
| Black | 205 | 115 | 90 |
| Hispanic | 259 | 151 | 108 |
| Native Hawaiian or Other Pacific Islanders | 5 | 2 | 3 |
| White | 1,868 | 1,102 | 766 |
| Two or more races | 85 | 56 | 29 |
| Race Unknown | 7 | 4 | 3 |
| Race | Total | Men | Women |
|---|---|---|---|
| American Indian or Native American | 7 | 5 | 2 |
| Asian | 158 | 104 | 54 |
| Black | 151 | 98 | 53 |
| Hispanic | 204 | 128 | 76 |
| Native Hawaiian or Other Pacific Islanders | 2 | 1 | 1 |
| White | 1,369 | 937 | 432 |
| Two or more races | 62 | 47 | 15 |
| Race Unknown | 7 | 4 | 3 |
| Race | Total | Men | Women |
|---|---|---|---|
| American Indian or Native American | 1 | 0 | 1 |
| Asian | 15 | 8 | 7 |
| Black | 20 | 5 | 15 |
| Hispanic | 28 | 15 | 13 |
| Native Hawaiian or Other Pacific Islanders | 0 | 0 | 0 |
| White | 156 | 96 | 60 |
| Two or more races | 6 | 6 | 0 |
| Race Unknown | 1 | 0 | 1 |
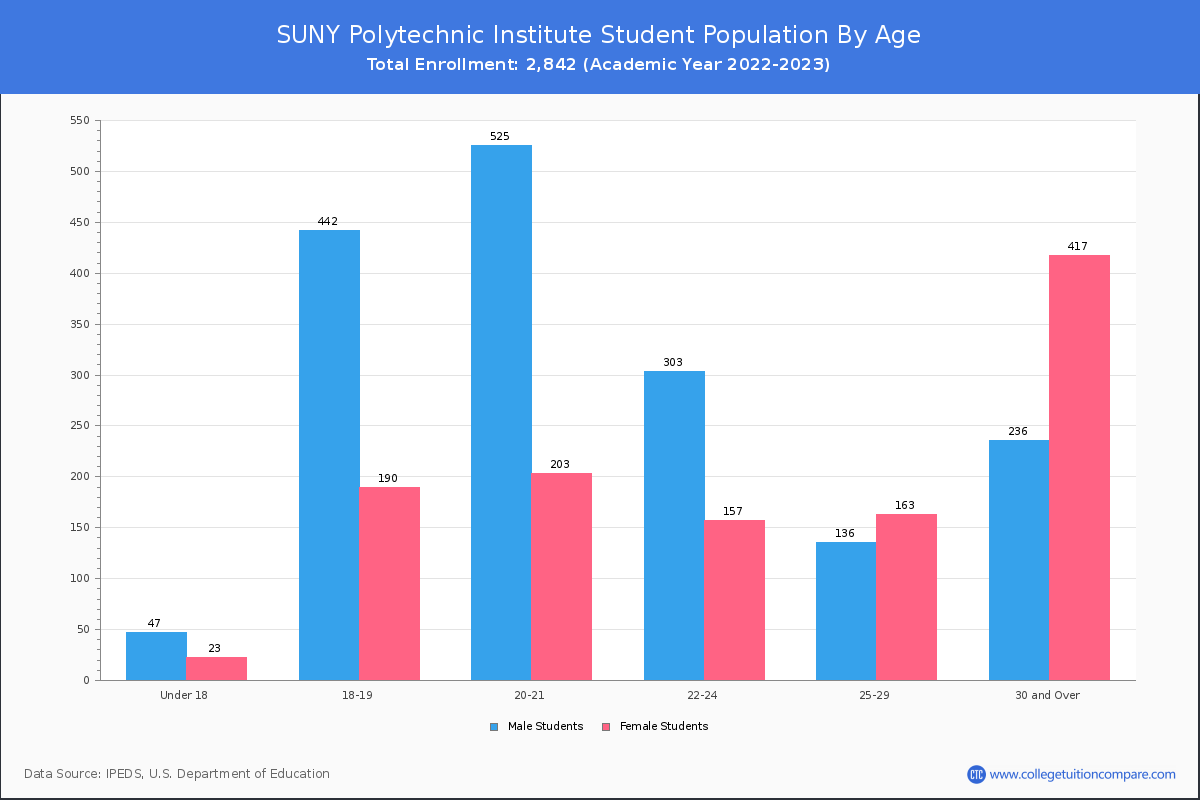
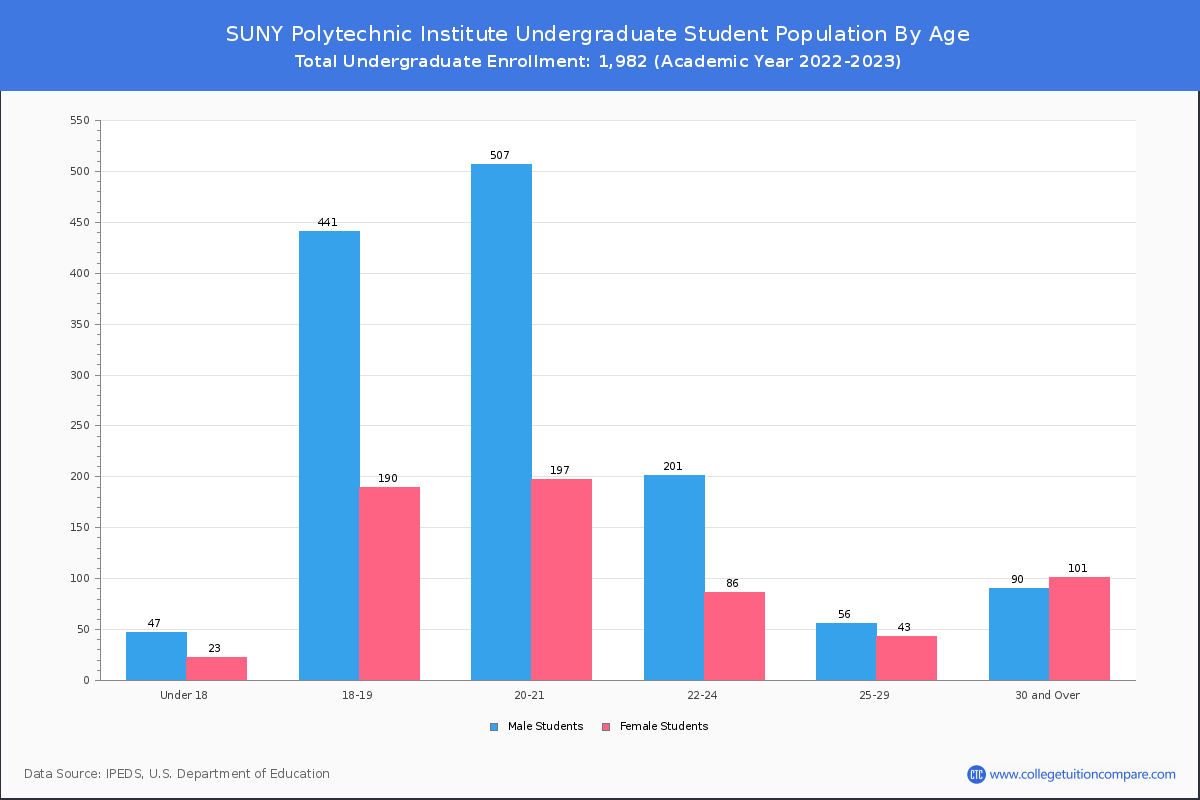
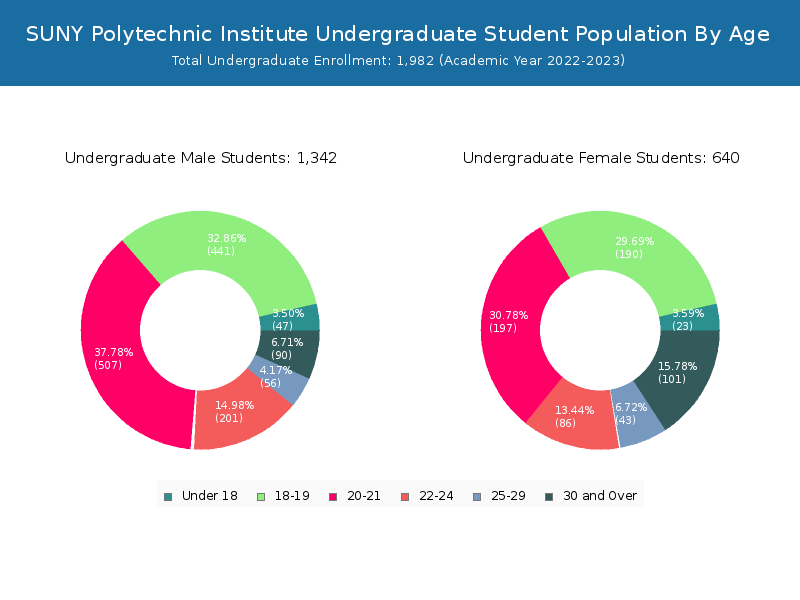
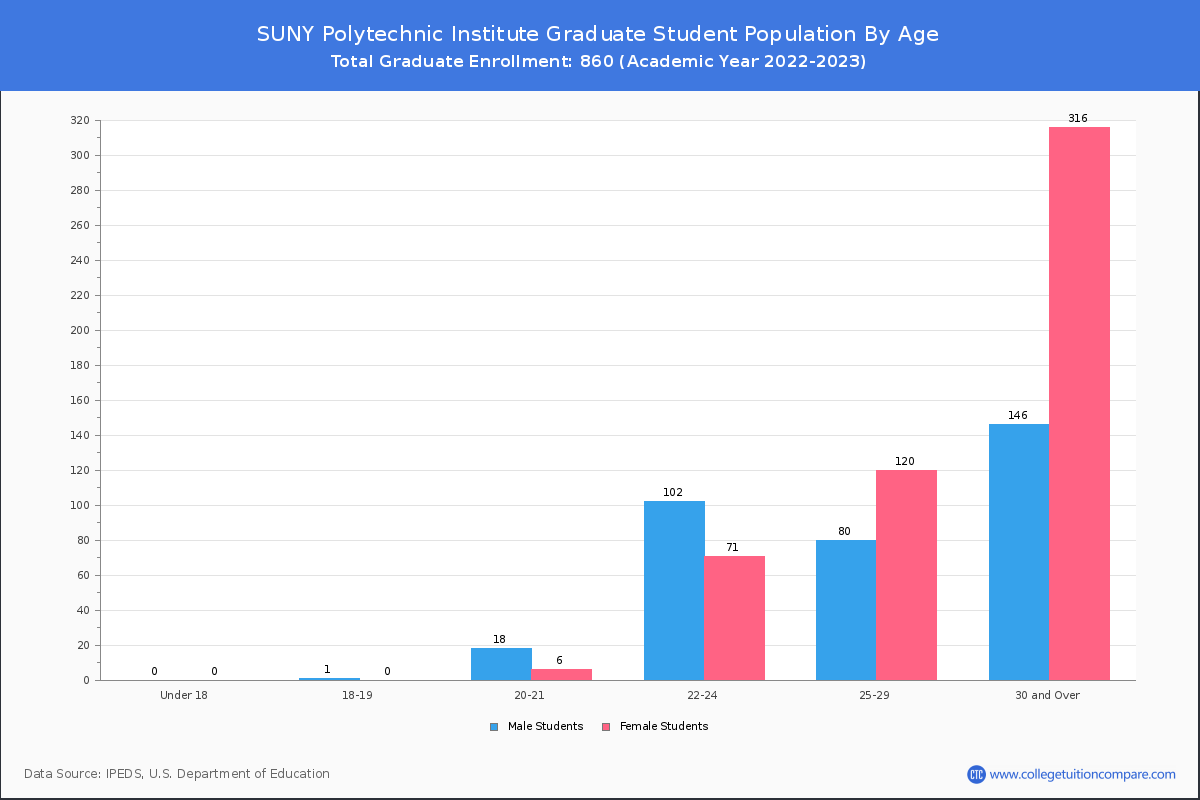
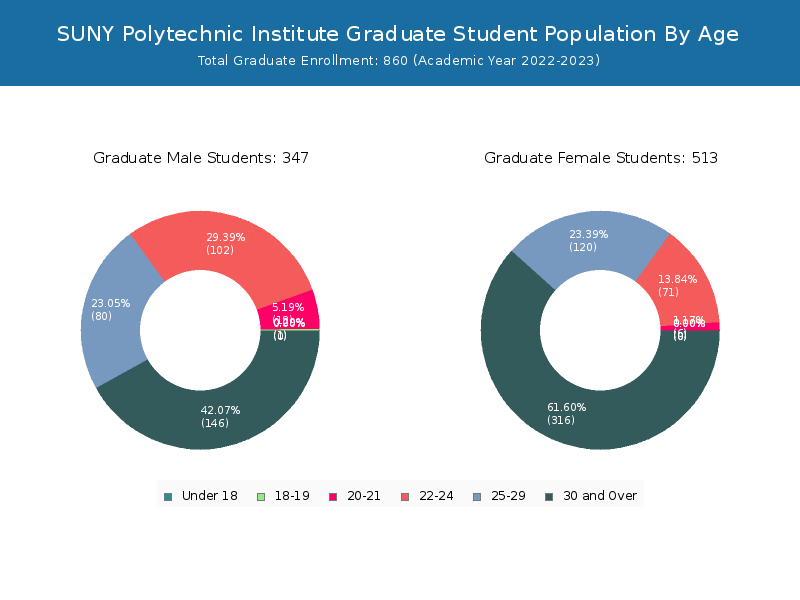
Student Age Distribution
By age, SUNY Poly has 70 students under 18 years old and 2 students over 65 years old. There are 1,890 students under 25 years old, and 952 students over 25 years old out of 2,842 total students.
SUNY Poly has 1,692 undergraduate students aged under 25 and 290 students aged 25 and over.
It has 198 graduate students aged under 25 and 662 students aged 25 and over.
| Age | Total | Men | Women |
|---|---|---|---|
| Under 18 | 70 | 23 | 47 |
| 18-19 | 632 | 190 | 442 |
| 20-21 | 728 | 203 | 525 |
| 22-24 | 460 | 157 | 303 |
| 25-29 | 299 | 163 | 136 |
| 30-34 | 218 | 129 | 89 |
| 35-39 | 155 | 102 | 53 |
| 40-49 | 199 | 127 | 72 |
| 50-64 | 79 | 59 | 20 |
| Over 65 | 2 | 0 | 2 |
| Age | Total | Men | Women |
|---|---|---|---|
| Under 18 | 70 | 23 | 47 |
| 18-19 | 631 | 190 | 441 |
| 20-21 | 704 | 197 | 507 |
| 22-24 | 287 | 86 | 201 |
| 25-29 | 99 | 43 | 56 |
| 30-34 | 74 | 35 | 39 |
| 35-39 | 45 | 23 | 22 |
| 40-49 | 52 | 29 | 23 |
| 50-64 | 20 | 14 | 6 |
| Age | Total | Men | Women |
|---|
Online Student Enrollment
Distance learning, also called online education, is very attractive to students, especially who want to continue education and work in field. At SUNY Polytechnic Institute, 1,004 students are enrolled exclusively in online courses and 1,224 students are enrolled in some online courses.
978 students lived in New York or jurisdiction in which the school is located are enrolled exclusively in online courses and 26 students live in other State or outside of the United States.
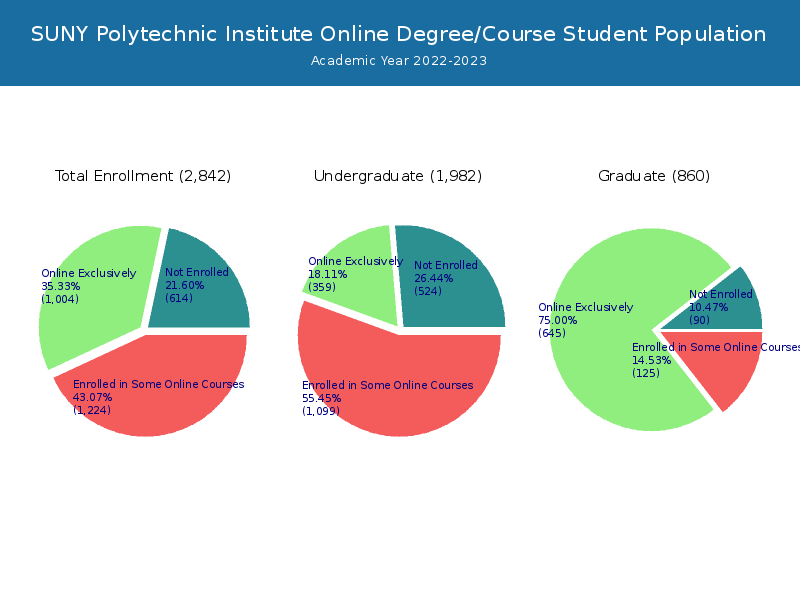
| All Students | Enrolled Exclusively Online Courses | Enrolled in Some Online Courses | |
|---|---|---|---|
| All Students | 2,842 | 1,004 | 1,224 |
| Undergraduate | 1,982 | 359 | 1,099 |
| Graduate | 860 | 645 | 125 |
| New York Residents | Other States in U.S. | Outside of U.S. | |
|---|---|---|---|
| All Students | 978 | 14 | 12 |
| Undergraduate | 353 | 6 | 0 |
| Graduate | 625 | 8 | 12 |
Transfer-in Students (Undergraduate)
Among 1,982 enrolled in undergraduate programs, 230 students have transferred-in from other institutions. The percentage of transfer-in students is 11.60%.212 students have transferred in as full-time status and 18 students transferred in as part-time status.
| Number of Students | |
|---|---|
| Regular Full-time | 1,497 |
| Transfer-in Full-time | 212 |
| Regular Part-time | 255 |
| Transfer-in Part-time | 18 |