Student Population by Gender
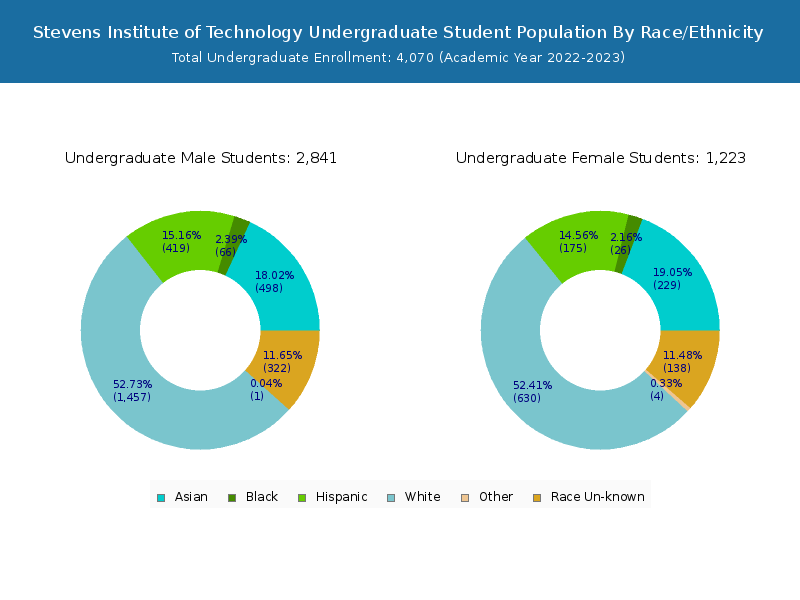
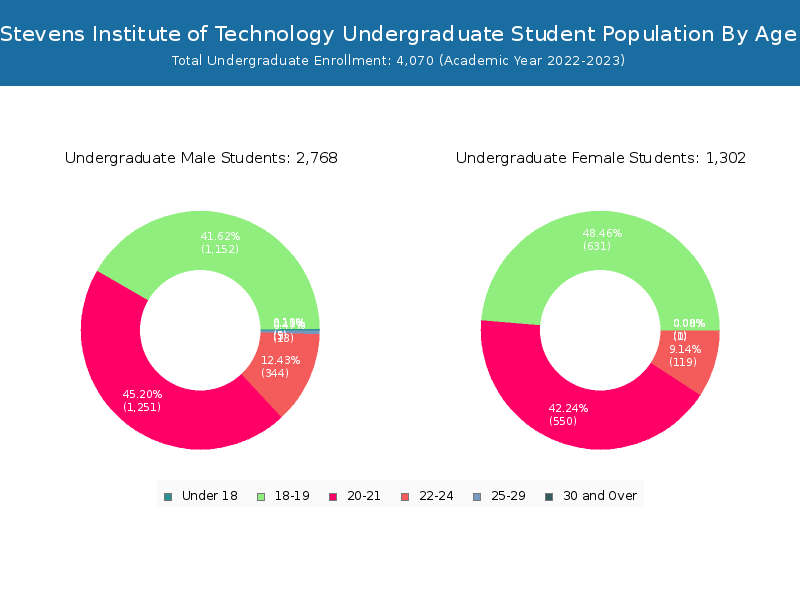
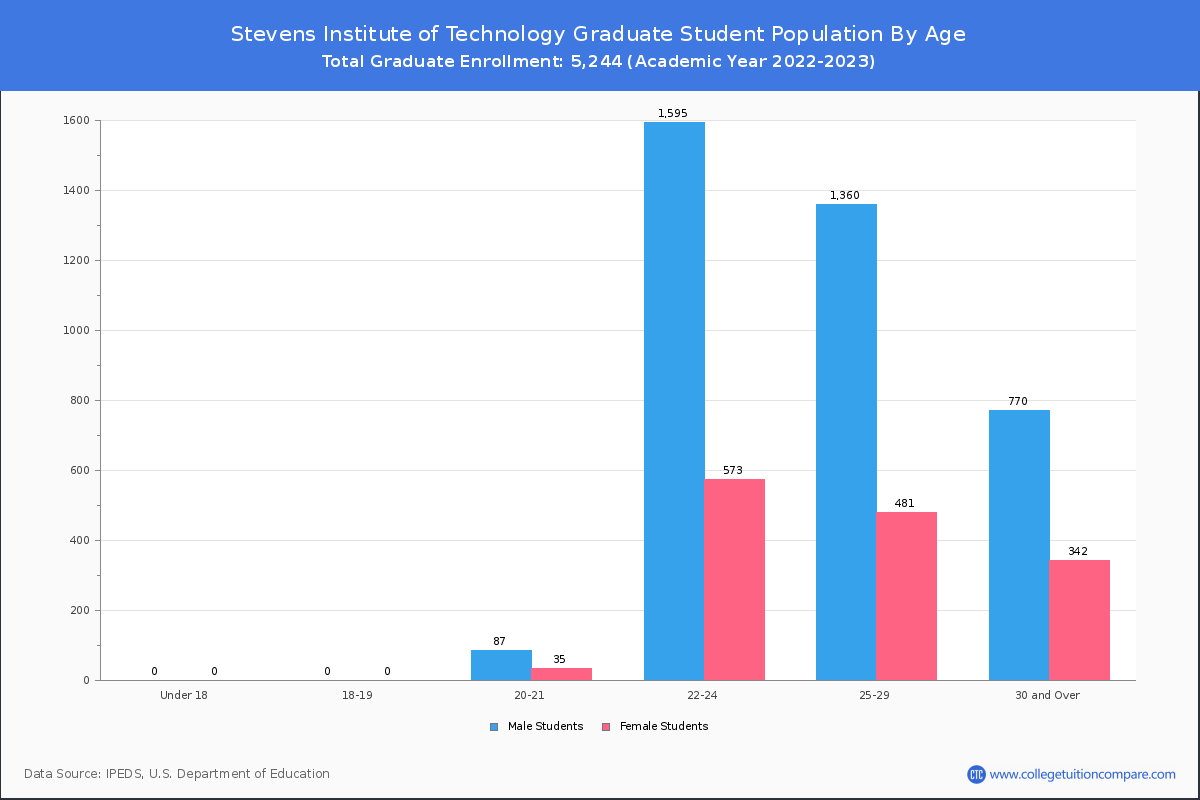
Stevens Institute of Technology has a total of 9,314 enrolled students for the academic year 2022-2023. 4,070 students have enrolled in undergraduate programs and 5,244 students joined graduate programs.
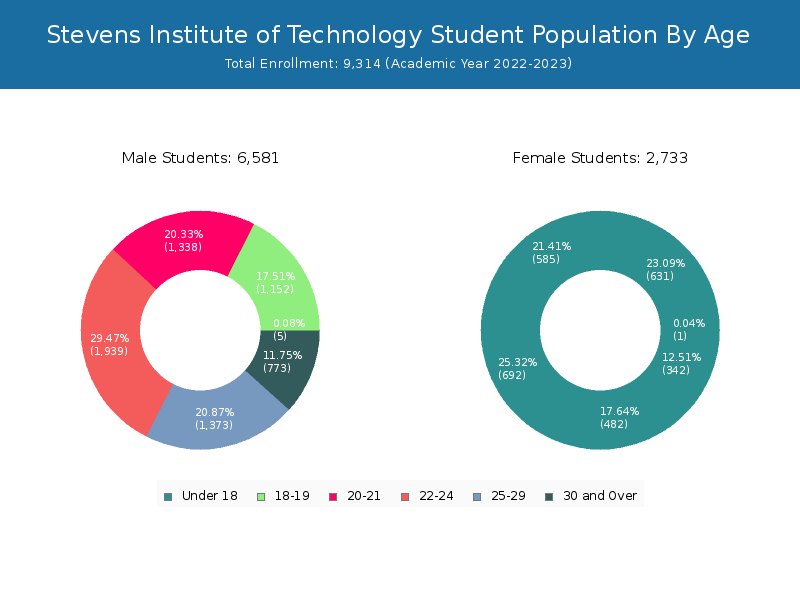
By gender, 6,581 male and 2,733 female students (the male-female ratio is 71:29) are attending the school. The gender distribution is based on the 2022-2023 data.
| Total | Undergraduate | Graduate | |
|---|---|---|---|
| Total | 9,314 | 4,070 | 5,244 |
| Men | 6,581 | 2,768 | 3,813 |
| Women | 2,733 | 1,302 | 1,431 |
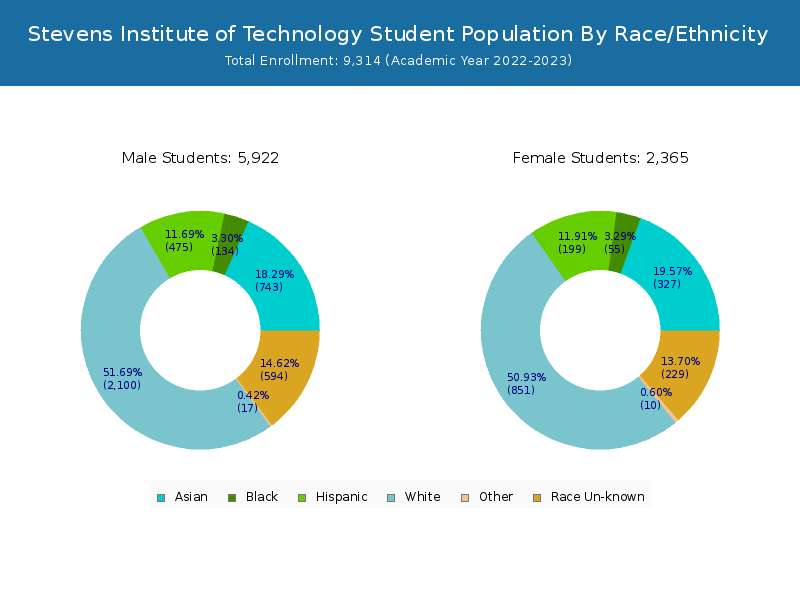

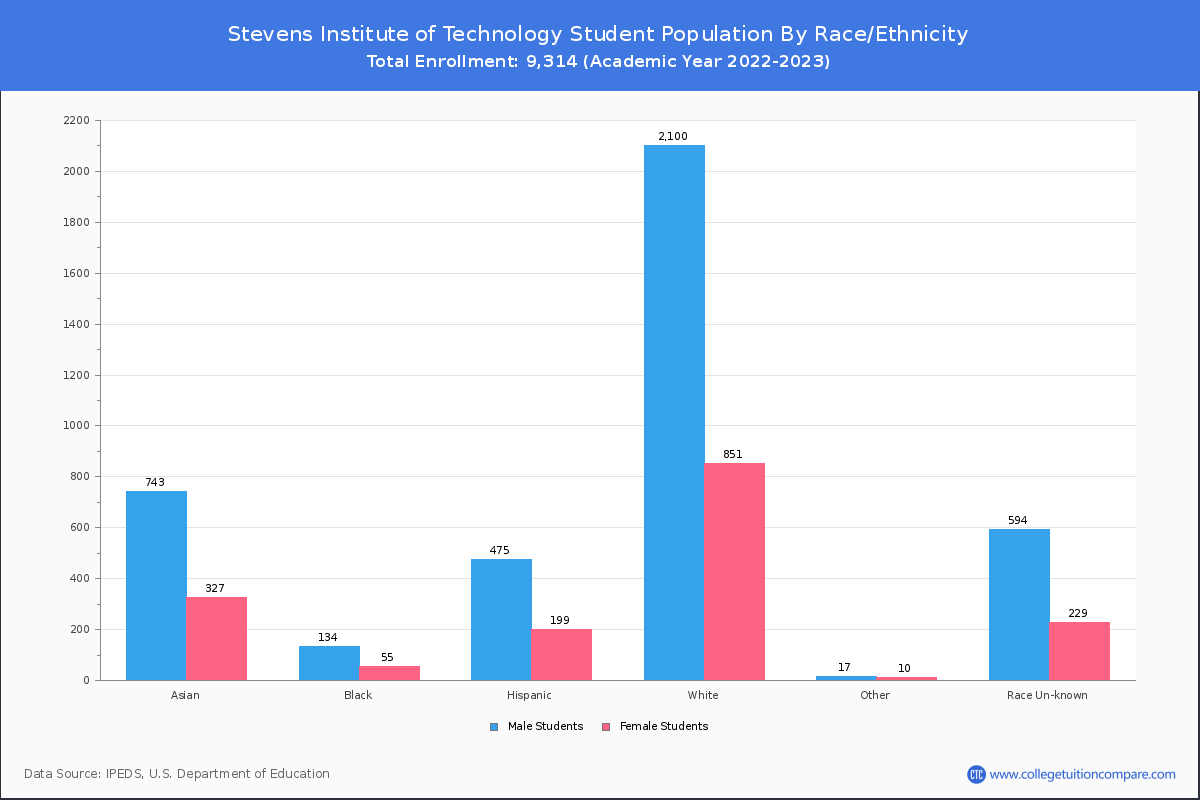
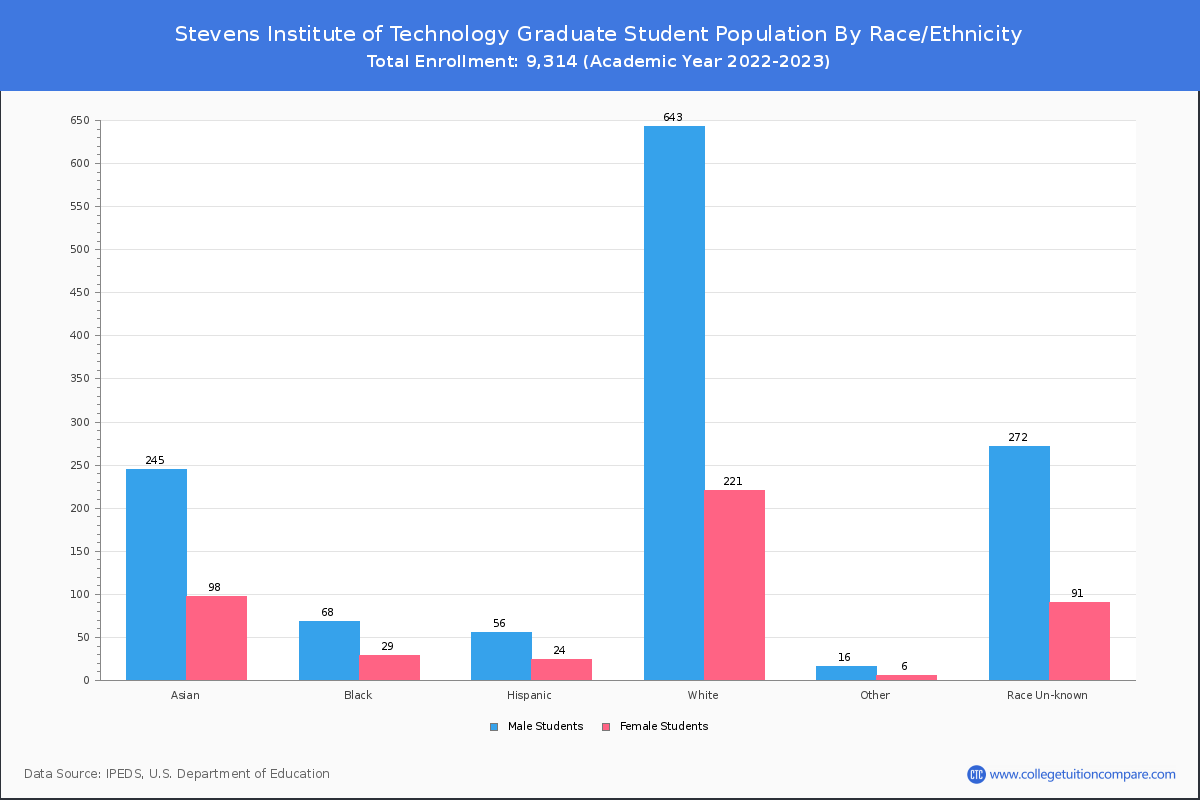
Student Distribution by Race/Ethnicity
By race/ethnicity, 2,697 White, 160 Black, and 987 Asian students out of a total of 9,314 are attending at Stevens Institute of Technology. Comprehensive enrollment statistic data by race/ethnicity is shown in the next chart (Academic year 2022-2023 data).
| Race | Total | Men | Women |
|---|---|---|---|
| American Indian or Native American | 0 | 0 | 0 |
| Asian | 987 | 660 | 327 |
| Black | 160 | 109 | 51 |
| Hispanic | 773 | 538 | 235 |
| Native Hawaiian or Other Pacific Islanders | 0 | 0 | 0 |
| White | 2,697 | 1,858 | 839 |
| Two or more races | 181 | 117 | 64 |
| Race Unknown | 900 | 654 | 246 |
| Race | Total | Men | Women |
|---|---|---|---|
| American Indian or Native American | 0 | 0 | 0 |
| Asian | 765 | 512 | 253 |
| Black | 92 | 64 | 28 |
| Hispanic | 619 | 424 | 195 |
| Native Hawaiian or Other Pacific Islanders | 0 | 0 | 0 |
| White | 2,056 | 1,396 | 660 |
| Two or more races | 152 | 94 | 58 |
| Race Unknown | 268 | 191 | 77 |
| Race | Total | Men | Women |
|---|---|---|---|
| American Indian or Native American | 0 | 0 | 0 |
| Asian | 4 | 3 | 1 |
| Black | 1 | 1 | 0 |
| Hispanic | 6 | 5 | 1 |
| Native Hawaiian or Other Pacific Islanders | 0 | 0 | 0 |
| White | 17 | 12 | 5 |
| Two or more races | 0 | 0 | 0 |
| Race Unknown | 2 | 2 | 0 |
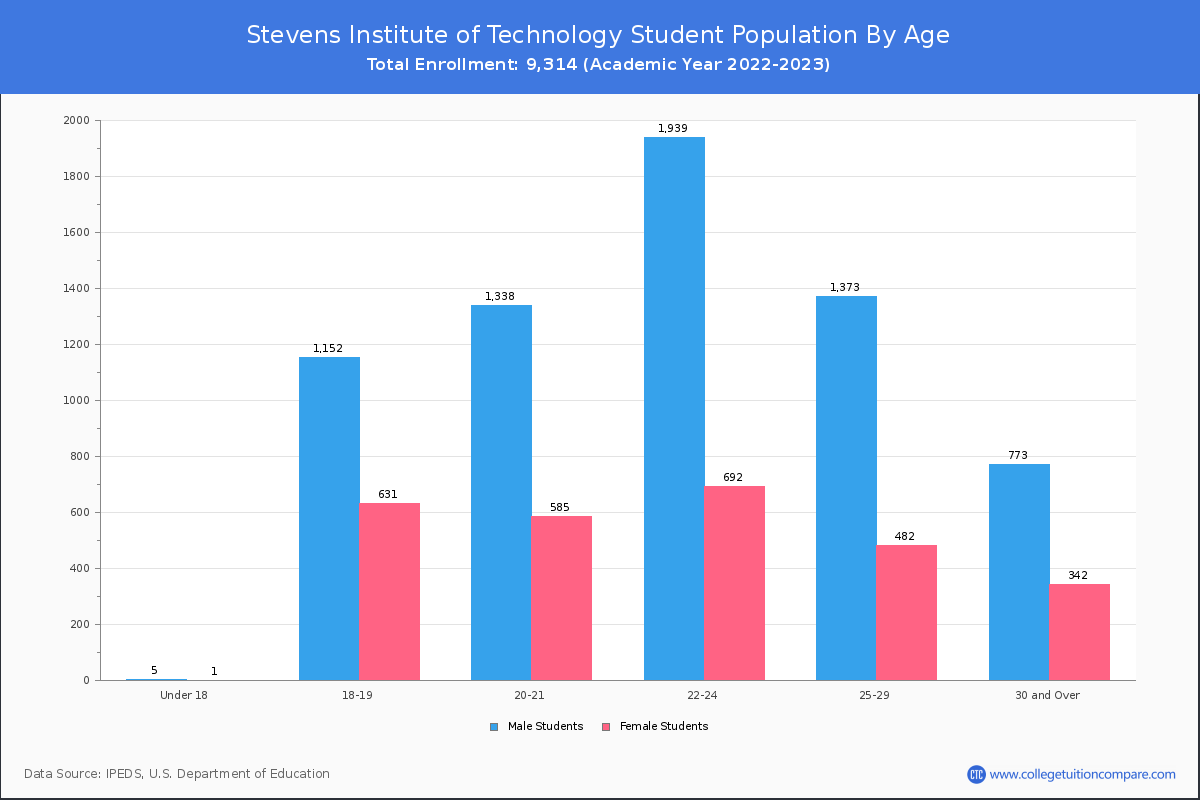
Student Age Distribution
By age, Stevens has 6 students under 18 years old and 6 students over 65 years old. There are 6,343 students under 25 years old, and 2,970 students over 25 years old out of 9,314 total students.
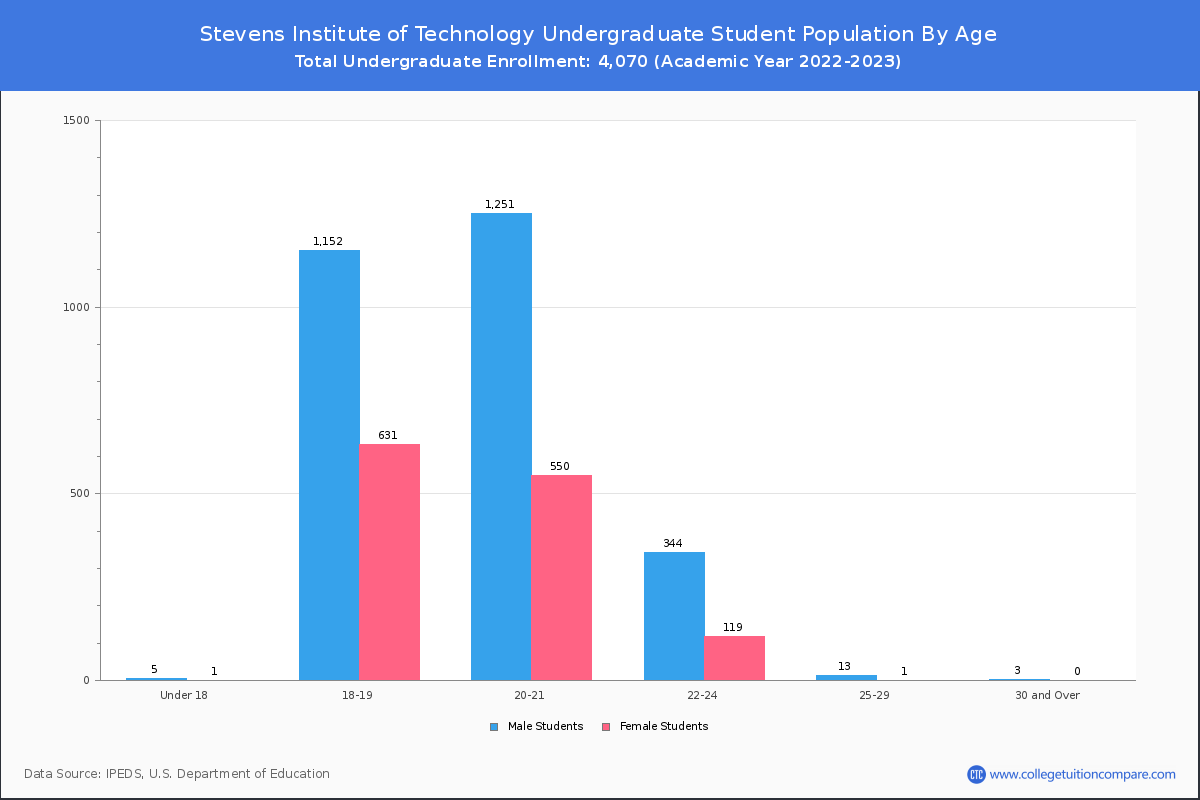
Stevens has 4,053 undergraduate students aged under 25 and 17 students aged 25 and over.
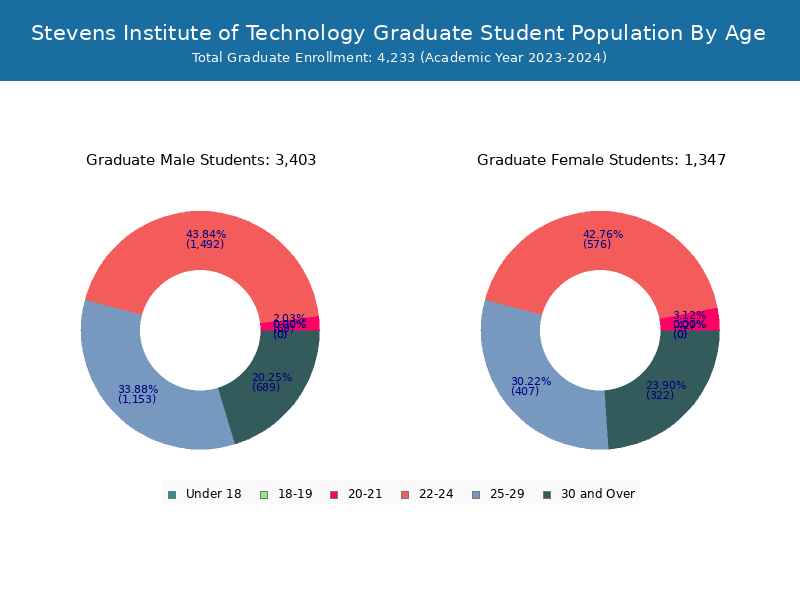
It has 2,290 graduate students aged under 25 and 2,953 students aged 25 and over.
| Age | Total | Men | Women |
|---|---|---|---|
| Under 18 | 6 | 1 | 5 |
| 18-19 | 1,783 | 631 | 1,152 |
| 20-21 | 1,923 | 585 | 1,338 |
| 22-24 | 2,631 | 692 | 1,939 |
| 25-29 | 1,855 | 482 | 1,373 |
| 30-34 | 528 | 167 | 361 |
| 35-39 | 225 | 70 | 155 |
| 40-49 | 255 | 74 | 181 |
| 50-64 | 101 | 30 | 71 |
| Over 65 | 6 | 1 | 5 |
| Age | Total | Men | Women |
|---|---|---|---|
| Under 18 | 6 | 1 | 5 |
| 18-19 | 1,783 | 631 | 1,152 |
| 20-21 | 1,801 | 550 | 1,251 |
| 22-24 | 463 | 119 | 344 |
| 25-29 | 14 | 1 | 13 |
| 30-34 | 1 | 0 | 1 |
| 35-39 | 1 | 0 | 1 |
| 40-49 | 1 | 0 | 1 |
| Age | Total | Men | Women |
|---|
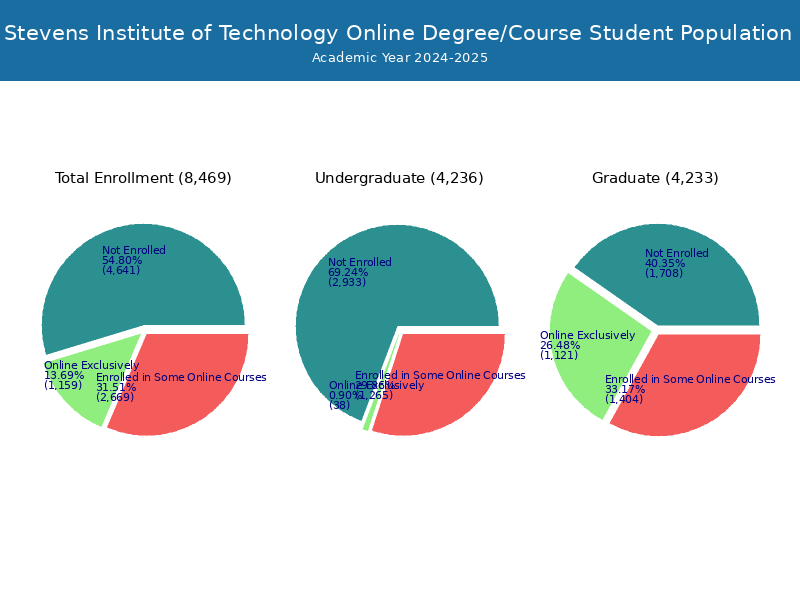
Online Student Enrollment
Distance learning, also called online education, is very attractive to students, especially who want to continue education and work in field. At Stevens Institute of Technology, 1,079 students are enrolled exclusively in online courses and 3,754 students are enrolled in some online courses.
470 students lived in New Jersey or jurisdiction in which the school is located are enrolled exclusively in online courses and 609 students live in other State or outside of the United States.
| All Students | Enrolled Exclusively Online Courses | Enrolled in Some Online Courses | |
|---|---|---|---|
| All Students | 9,314 | 1,079 | 3,754 |
| Undergraduate | 4,070 | 2 | 1,337 |
| Graduate | 5,244 | 1,077 | 2,417 |
| New Jersey Residents | Other States in U.S. | Outside of U.S. | |
|---|---|---|---|
| All Students | 470 | 609 | 0 |
| Undergraduate | 0 | 2 | 0 |
| Graduate | 470 | 607 | 0 |
Transfer-in Students (Undergraduate)
Among 4,070 enrolled in undergraduate programs, 35 students have transferred-in from other institutions. The percentage of transfer-in students is 0.86%.
| Number of Students | |
|---|---|
| Regular Full-time | 4,015 |
| Transfer-in Full-time | 35 |