Student Population by Gender
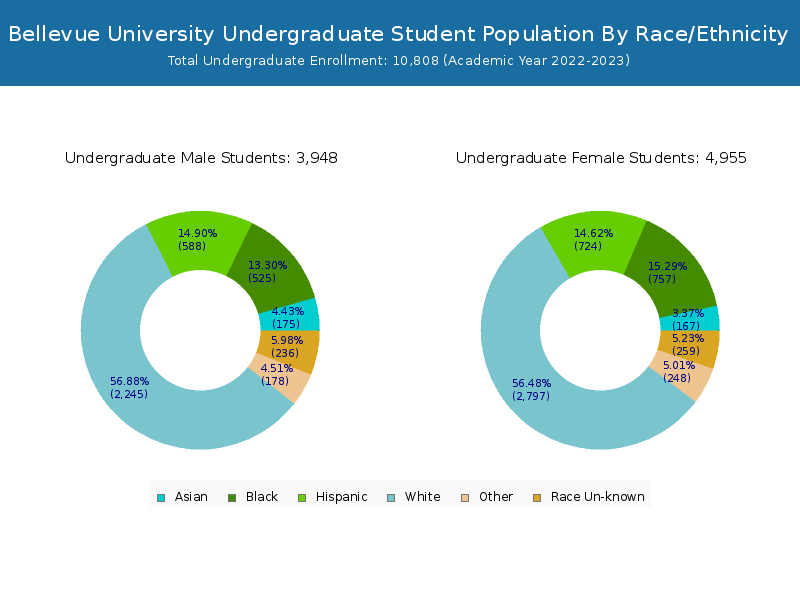
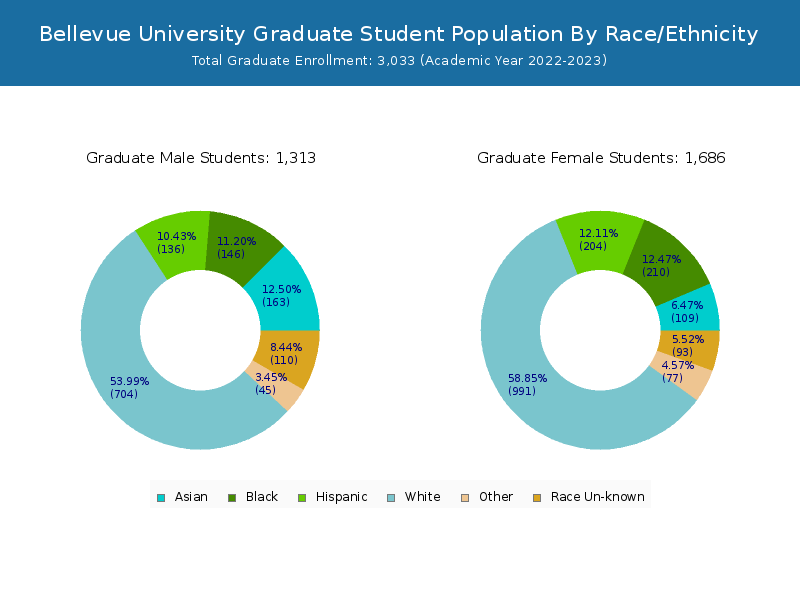
Bellevue University has a total of 13,841 enrolled students for the academic year 2022-2023. 10,808 students have enrolled in undergraduate programs and 3,033 students joined graduate programs.
By gender, 5,964 male and 7,877 female students (the male-female ratio is 43:57) are attending the school. The gender distribution is based on the 2022-2023 data.
| Total | Undergraduate | Graduate | |
|---|---|---|---|
| Total | 13,841 | 10,808 | 3,033 |
| Men | 5,964 | 4,764 | 1,200 |
| Women | 7,877 | 6,044 | 1,833 |
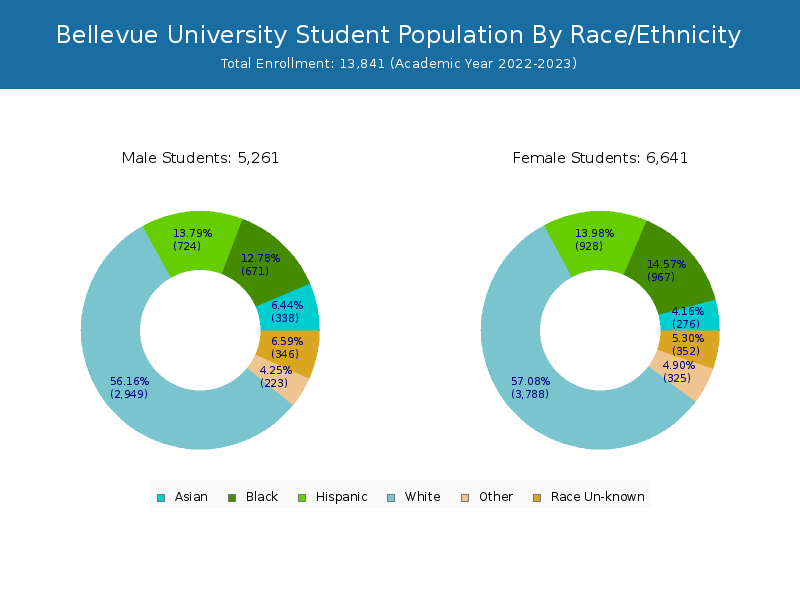
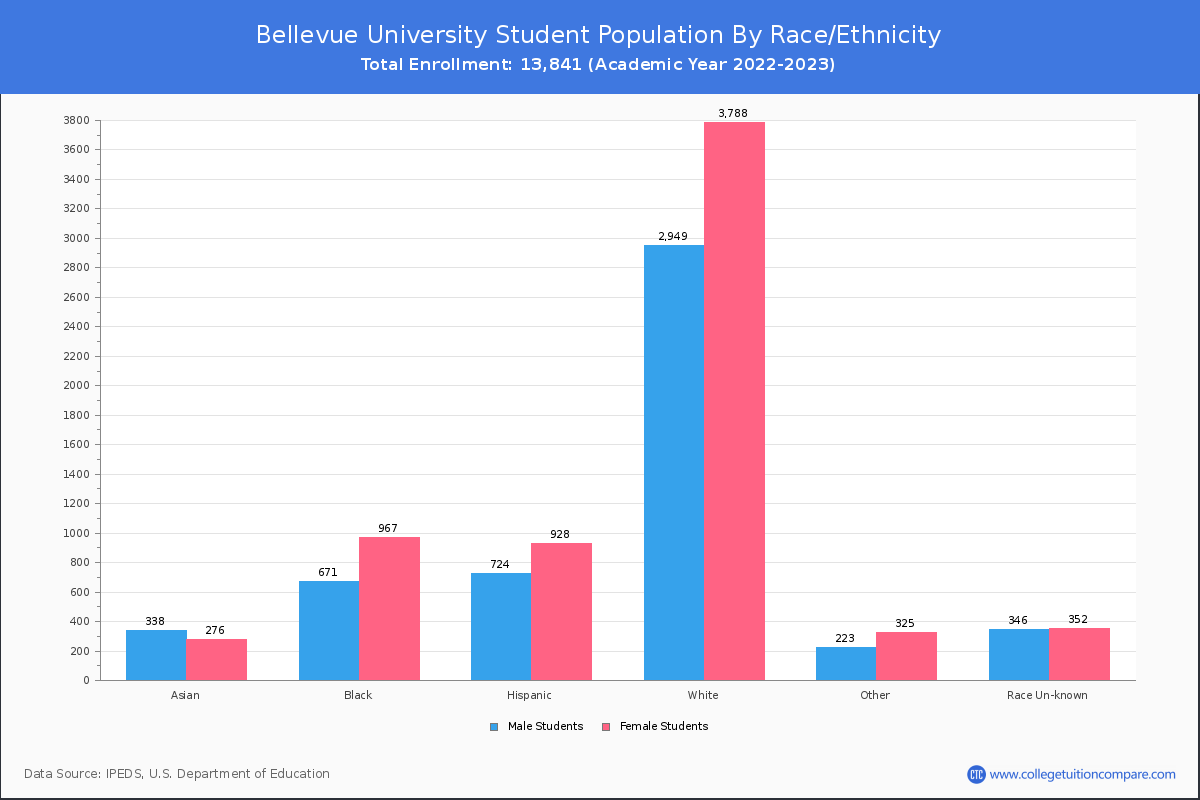
Student Distribution by Race/Ethnicity
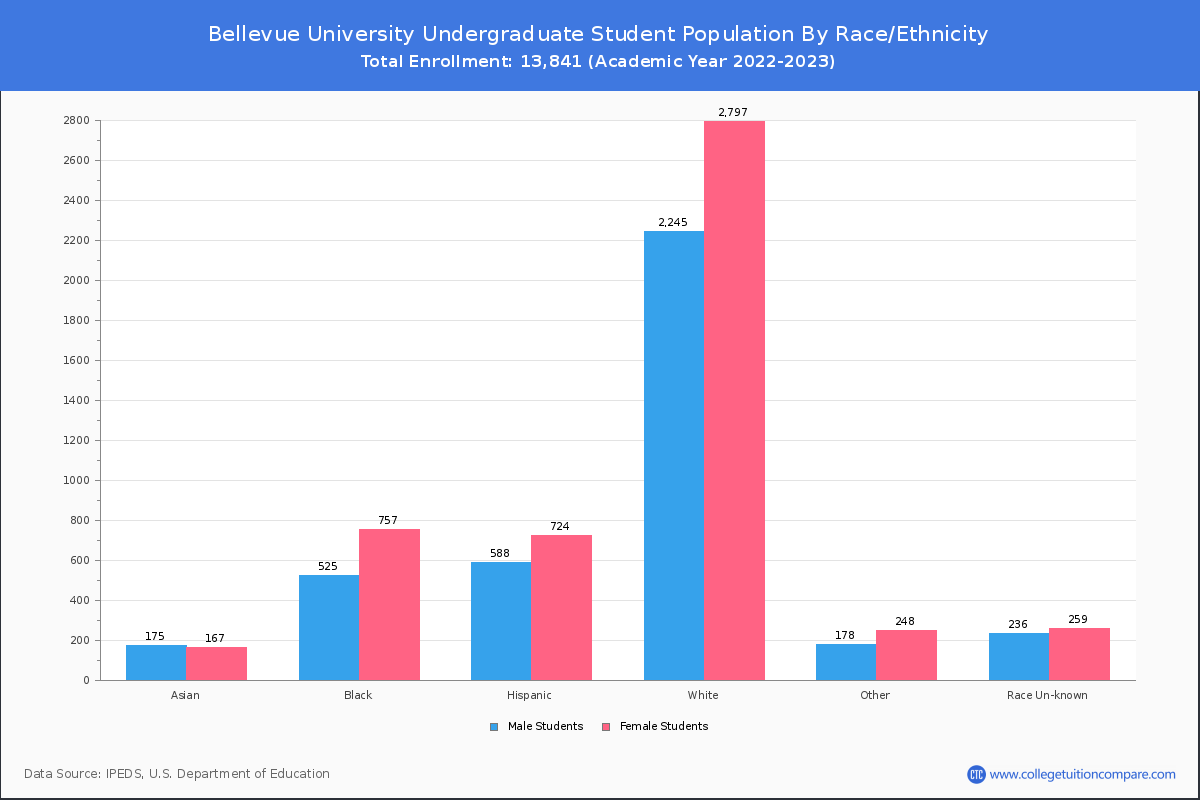
By race/ethnicity, 7,316 White, 2,169 Black, and 603 Asian students out of a total of 13,841 are attending at Bellevue University. Comprehensive enrollment statistic data by race/ethnicity is shown in the next chart (Academic year 2022-2023 data).
| Race | Total | Men | Women |
|---|---|---|---|
| American Indian or Native American | 97 | 33 | 64 |
| Asian | 603 | 328 | 275 |
| Black | 2,169 | 831 | 1,338 |
| Hispanic | 2,249 | 1,030 | 1,219 |
| Native Hawaiian or Other Pacific Islanders | 50 | 17 | 33 |
| White | 7,316 | 3,105 | 4,211 |
| Two or more races | 474 | 197 | 277 |
| Race Unknown | 878 | 420 | 458 |
| Race | Total | Men | Women |
|---|---|---|---|
| American Indian or Native American | 79 | 30 | 49 |
| Asian | 335 | 174 | 161 |
| Black | 1,785 | 681 | 1,104 |
| Hispanic | 1,842 | 882 | 960 |
| Native Hawaiian or Other Pacific Islanders | 42 | 13 | 29 |
| White | 5,726 | 2,512 | 3,214 |
| Two or more races | 367 | 160 | 207 |
| Race Unknown | 628 | 309 | 319 |
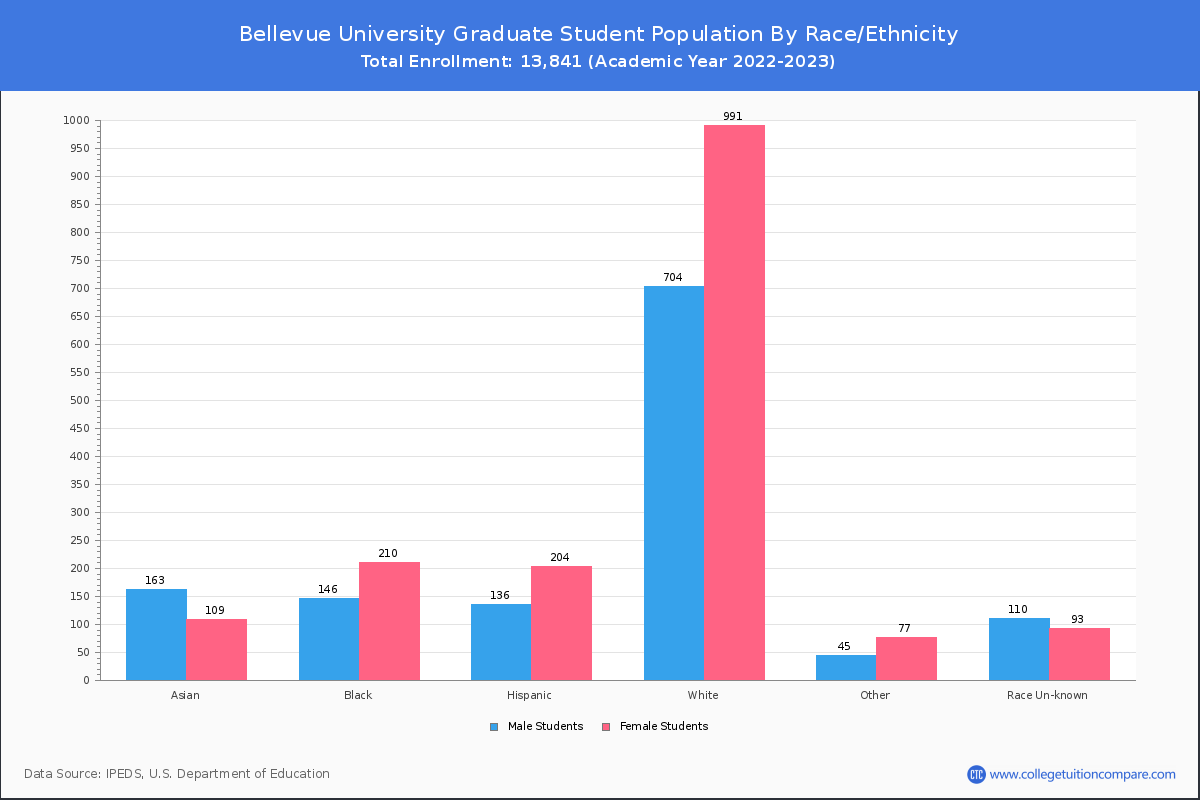
| Race | Total | Men | Women |
|---|---|---|---|
| American Indian or Native American | 22 | 8 | 14 |
| Asian | 98 | 56 | 42 |
| Black | 603 | 229 | 374 |
| Hispanic | 562 | 279 | 283 |
| Native Hawaiian or Other Pacific Islanders | 15 | 4 | 11 |
| White | 1,521 | 686 | 835 |
| Two or more races | 122 | 56 | 66 |
| Race Unknown | 147 | 84 | 63 |
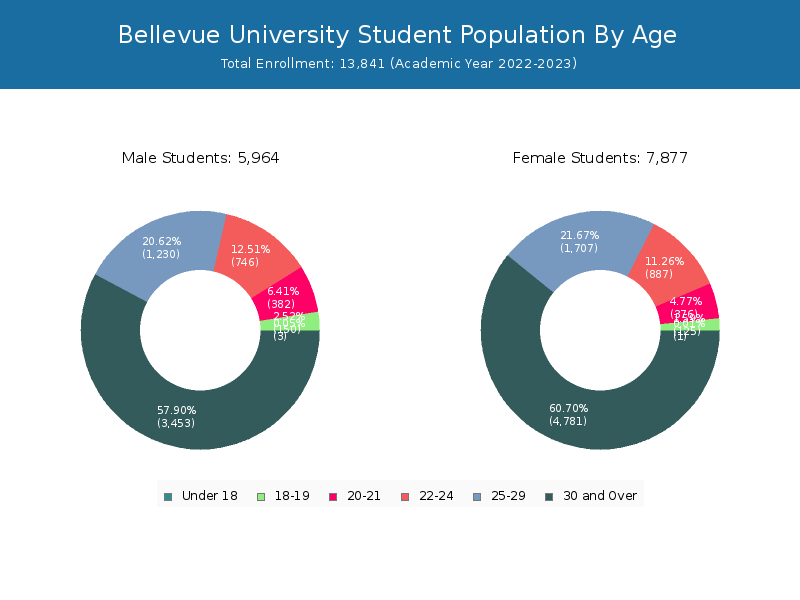
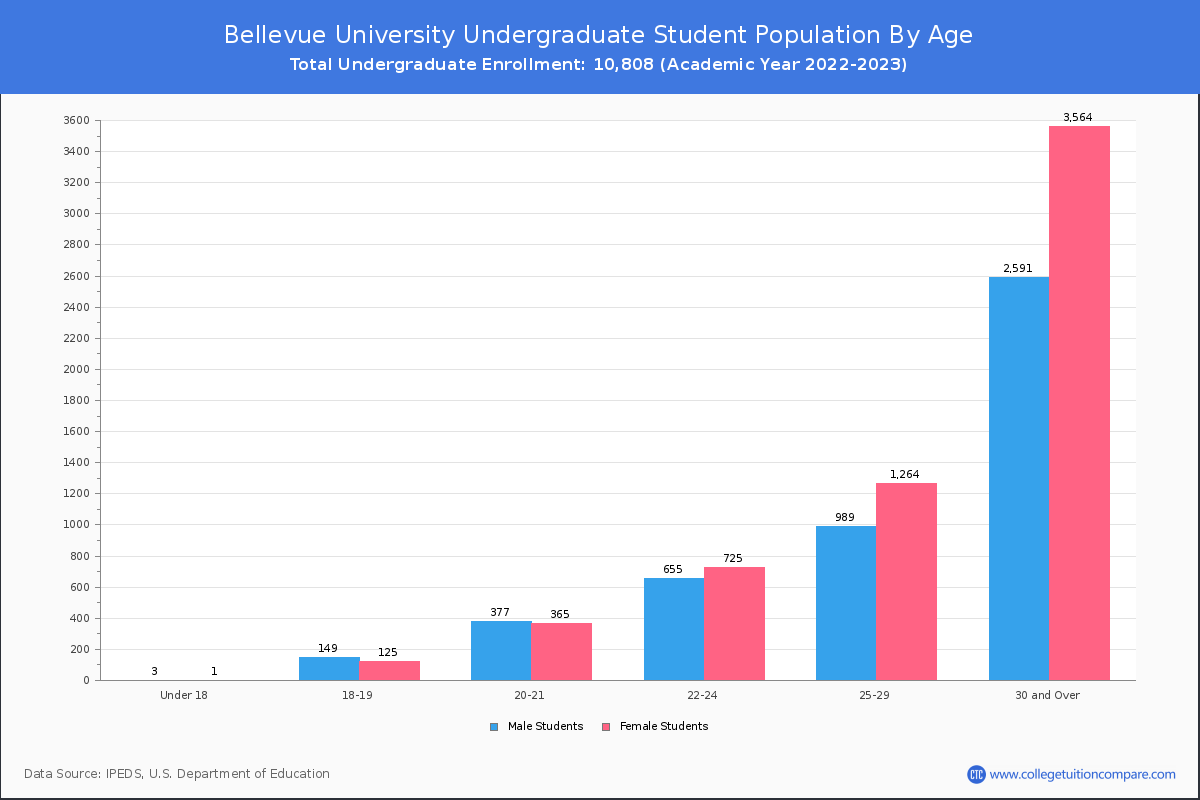
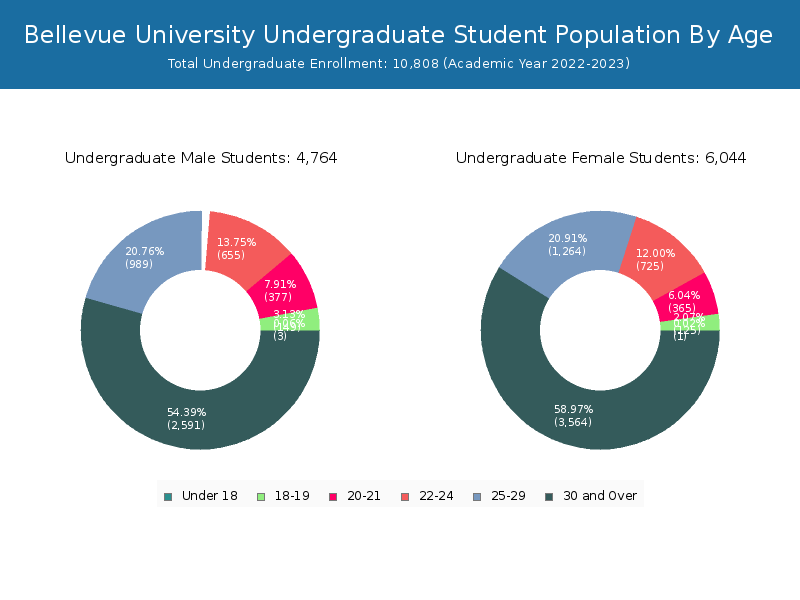
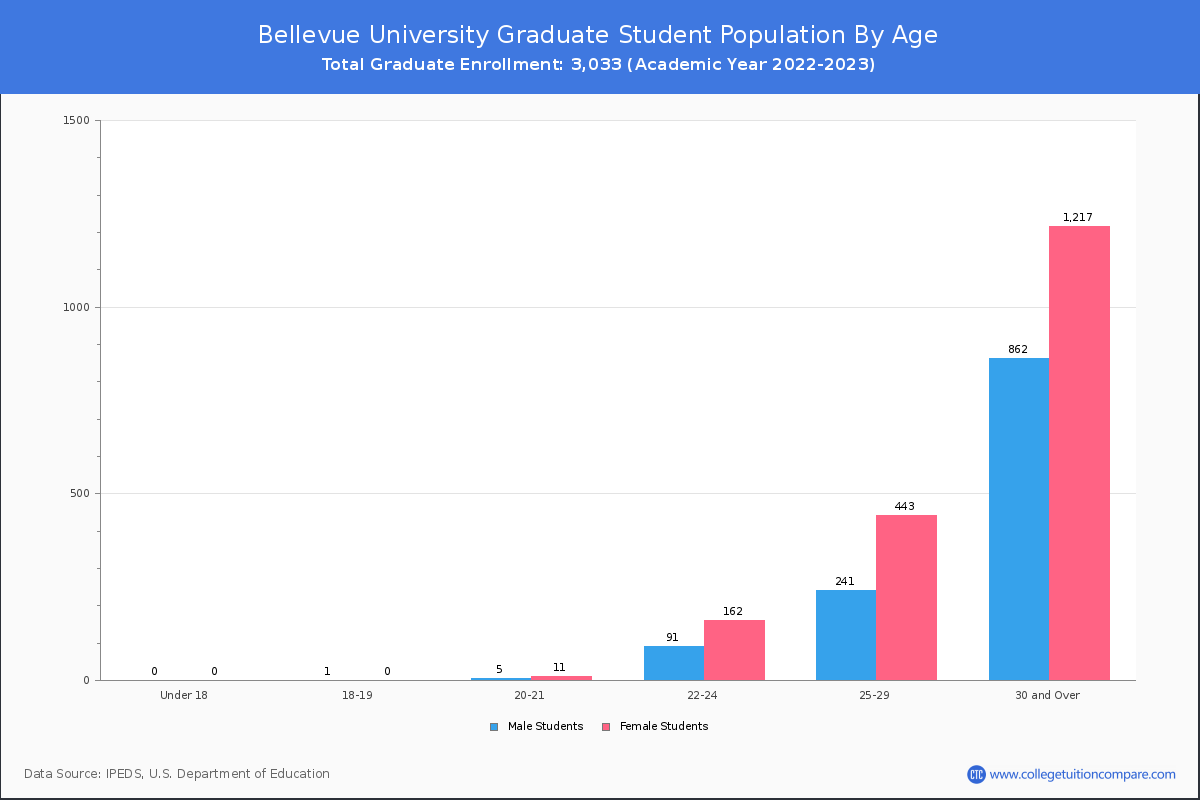
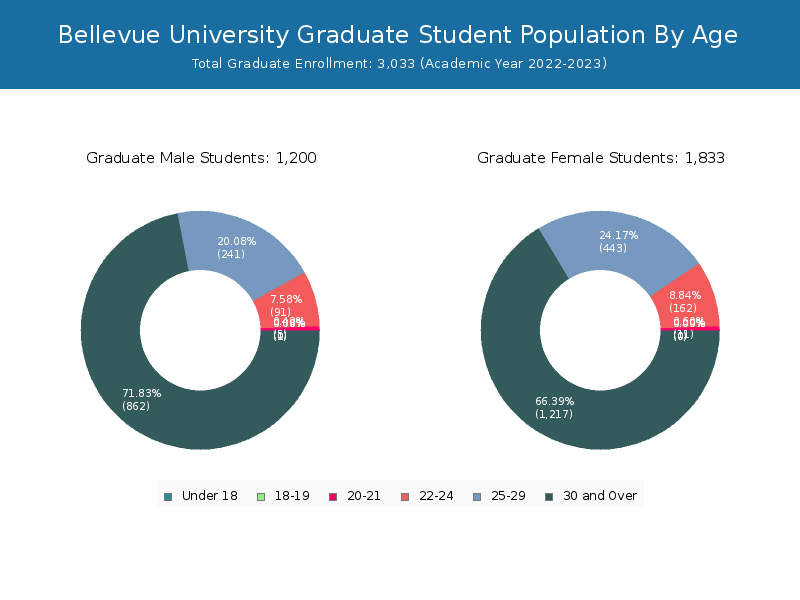
Student Age Distribution
By age, Bellevue has 4 students under 18 years old and 58 students over 65 years old. There are 2,670 students under 25 years old, and 11,171 students over 25 years old out of 13,841 total students.
In undergraduate programs, 4 students are younger than 18 and 47 students are older than 65. Bellevue has 2,400 undergraduate students aged under 25 and 8,408 students aged 25 and over.
It has 270 graduate students aged under 25 and 2,763 students aged 25 and over.
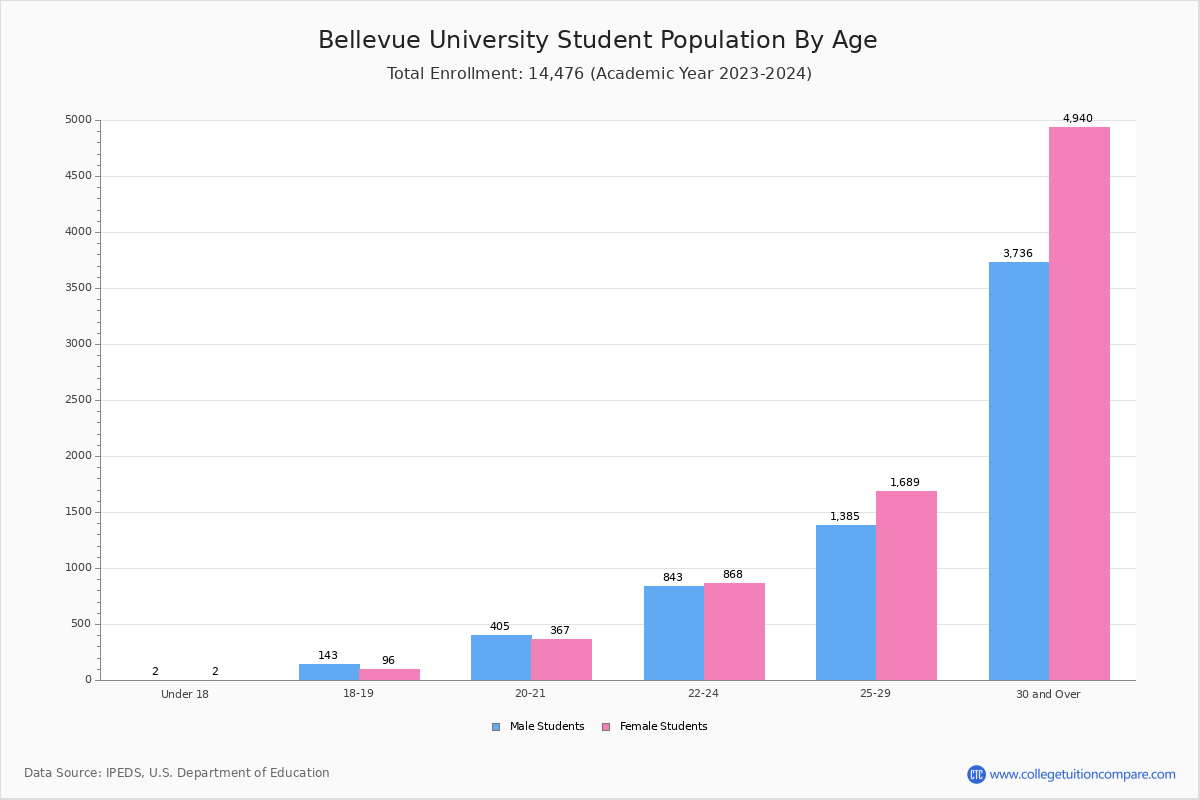
| Age | Total | Men | Women |
|---|---|---|---|
| Under 18 | 4 | 1 | 3 |
| 18-19 | 275 | 125 | 150 |
| 20-21 | 758 | 376 | 382 |
| 22-24 | 1,633 | 887 | 746 |
| 25-29 | 2,937 | 1,707 | 1,230 |
| 30-34 | 2,647 | 1,484 | 1,163 |
| 35-39 | 2,032 | 1,139 | 893 |
| 40-49 | 2,432 | 1,486 | 946 |
| 50-64 | 1,065 | 651 | 414 |
| Over 65 | 58 | 21 | 37 |
| Age | Total | Men | Women |
|---|---|---|---|
| Under 18 | 4 | 1 | 3 |
| 18-19 | 274 | 125 | 149 |
| 20-21 | 742 | 365 | 377 |
| 22-24 | 1,380 | 725 | 655 |
| 25-29 | 2,253 | 1,264 | 989 |
| 30-34 | 2,050 | 1,135 | 915 |
| 35-39 | 1,516 | 848 | 668 |
| 40-49 | 1,757 | 1,085 | 672 |
| 50-64 | 785 | 482 | 303 |
| Over 65 | 47 | 14 | 33 |
| Age | Total | Men | Women |
|---|
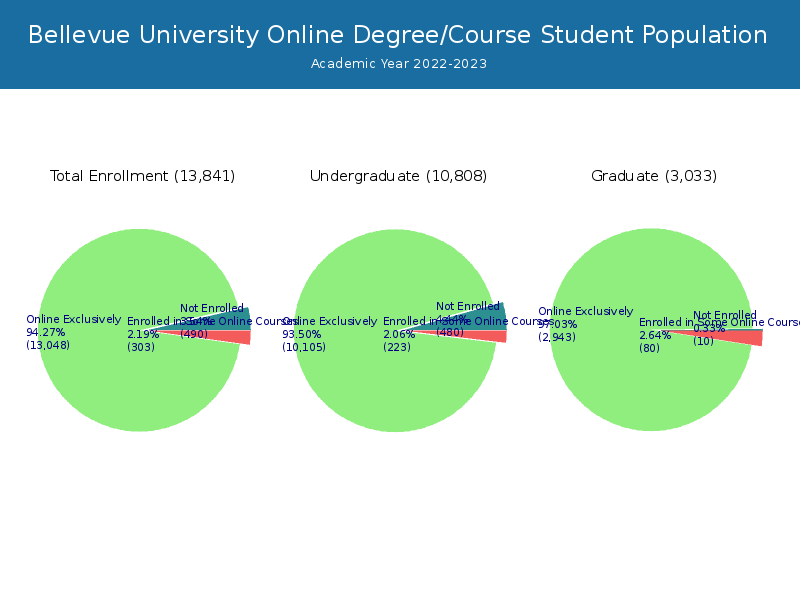
Online Student Enrollment
Distance learning, also called online education, is very attractive to students, especially who want to continue education and work in field. At Bellevue University, 13,048 students are enrolled exclusively in online courses and 303 students are enrolled in some online courses.
1,998 students lived in Nebraska or jurisdiction in which the school is located are enrolled exclusively in online courses and 11,050 students live in other State or outside of the United States.
| All Students | Enrolled Exclusively Online Courses | Enrolled in Some Online Courses | |
|---|---|---|---|
| All Students | 13,841 | 13,048 | 303 |
| Undergraduate | 10,808 | 10,105 | 223 |
| Graduate | 3,033 | 2,943 | 80 |
| Nebraska Residents | Other States in U.S. | Outside of U.S. | |
|---|---|---|---|
| All Students | 1,998 | 10,948 | 102 |
| Undergraduate | 1,243 | 8,815 | 47 |
| Graduate | 755 | 2,133 | 55 |
Transfer-in Students (Undergraduate)
Among 10,808 enrolled in undergraduate programs, 3,090 students have transferred-in from other institutions. The percentage of transfer-in students is 28.59%.1,555 students have transferred in as full-time status and 1,535 students transferred in as part-time status.
| Number of Students | |
|---|---|
| Regular Full-time | 4,954 |
| Transfer-in Full-time | 1,555 |
| Regular Part-time | 2,764 |
| Transfer-in Part-time | 1,535 |