Student Population by Gender
University of Michigan-Ann Arbor has a total of 51,225 enrolled students for the academic year 2022-2023. 32,695 students have enrolled in undergraduate programs and 18,530 students joined graduate programs.
By gender, 24,739 male and 26,486 female students (the male-female ratio is 48:52) are attending the school. The gender distribution is based on the 2022-2023 data.
| Total | Undergraduate | Graduate | |
|---|---|---|---|
| Total | 51,225 | 32,695 | 18,530 |
| Men | 24,739 | 15,580 | 9,159 |
| Women | 26,486 | 17,115 | 9,371 |
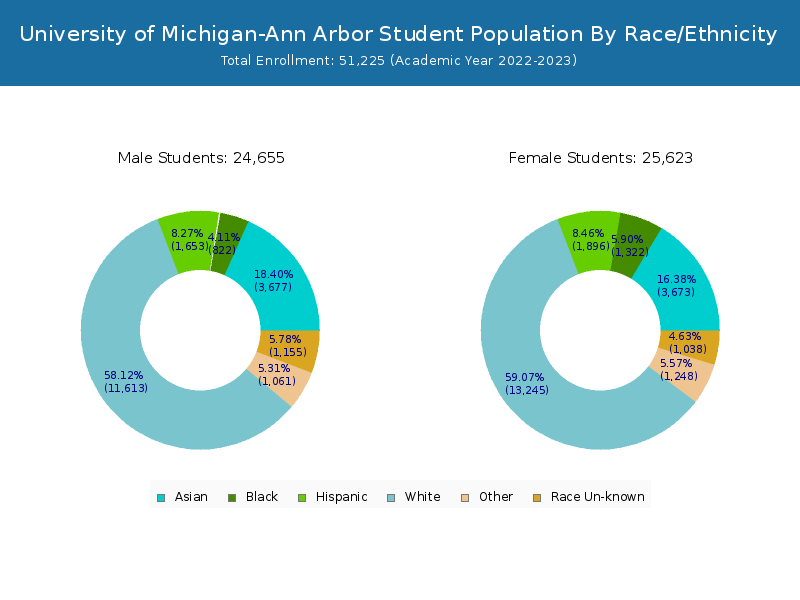
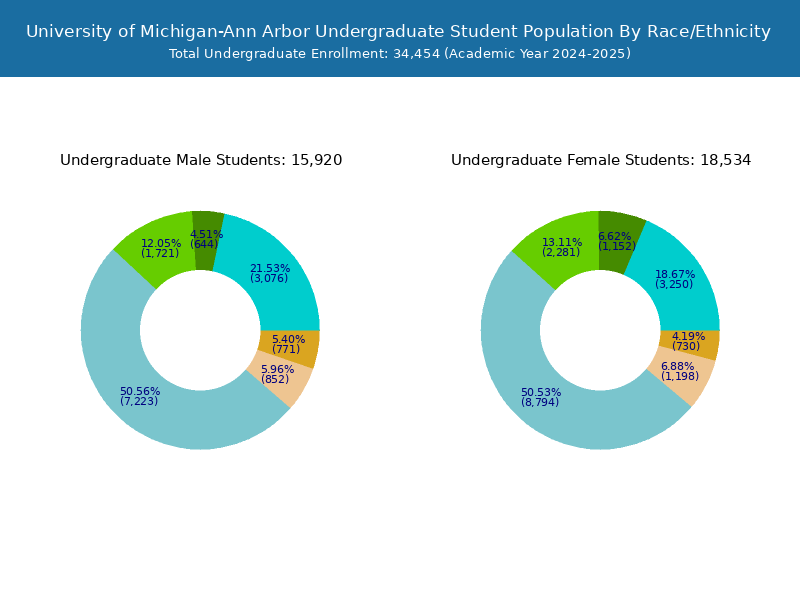
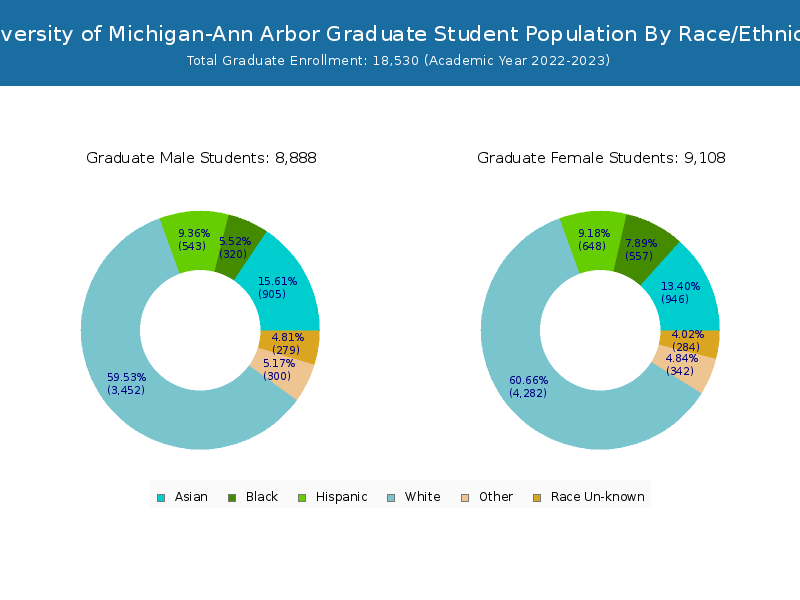
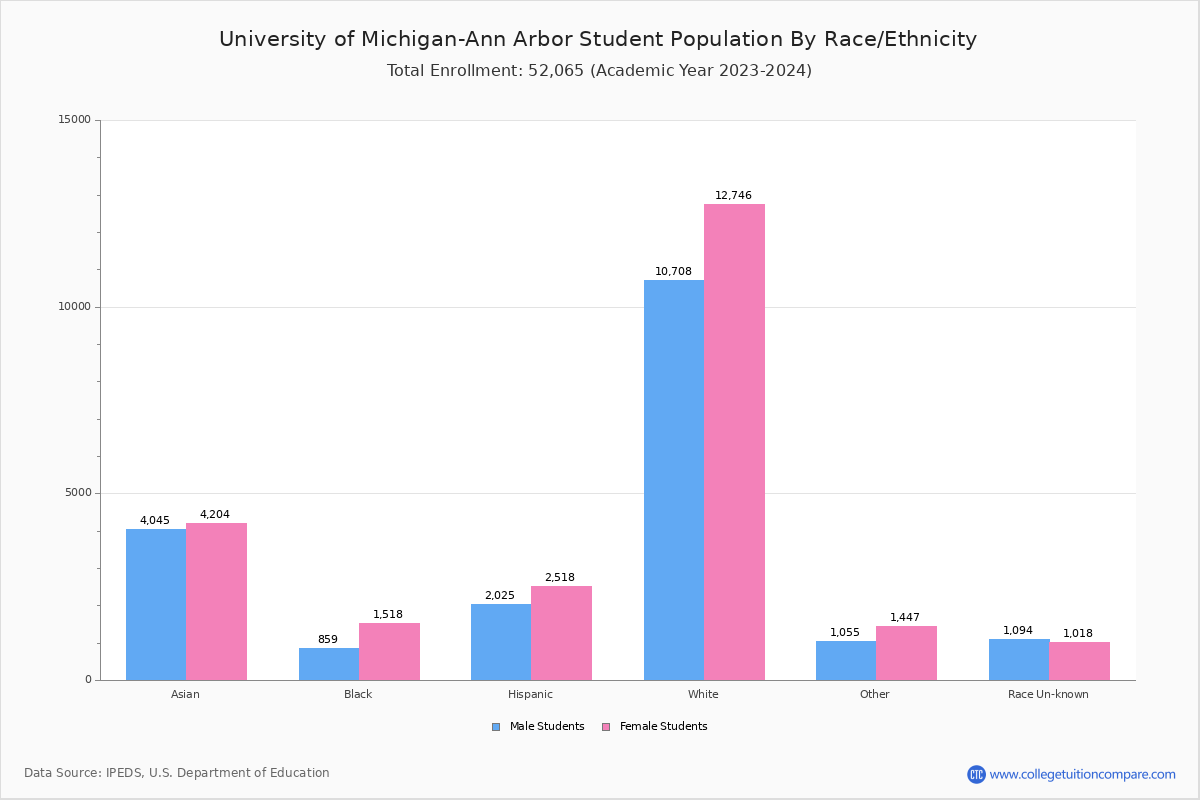
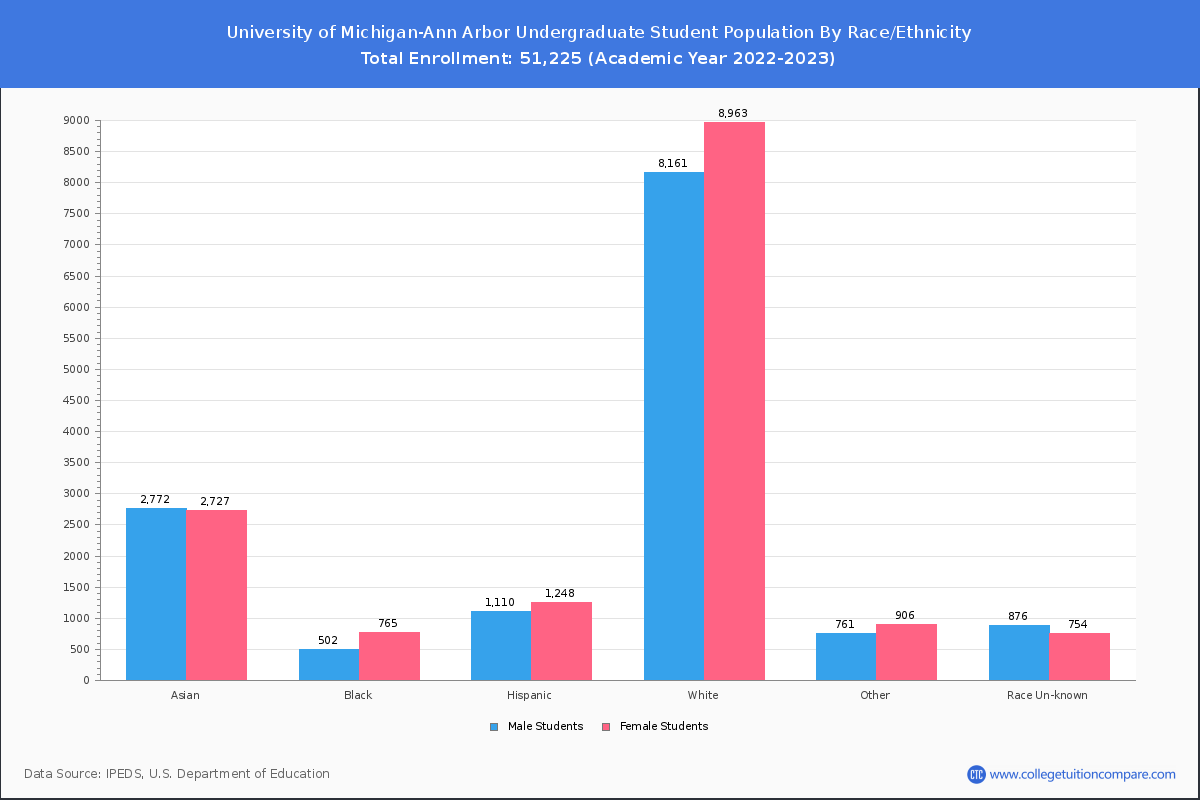
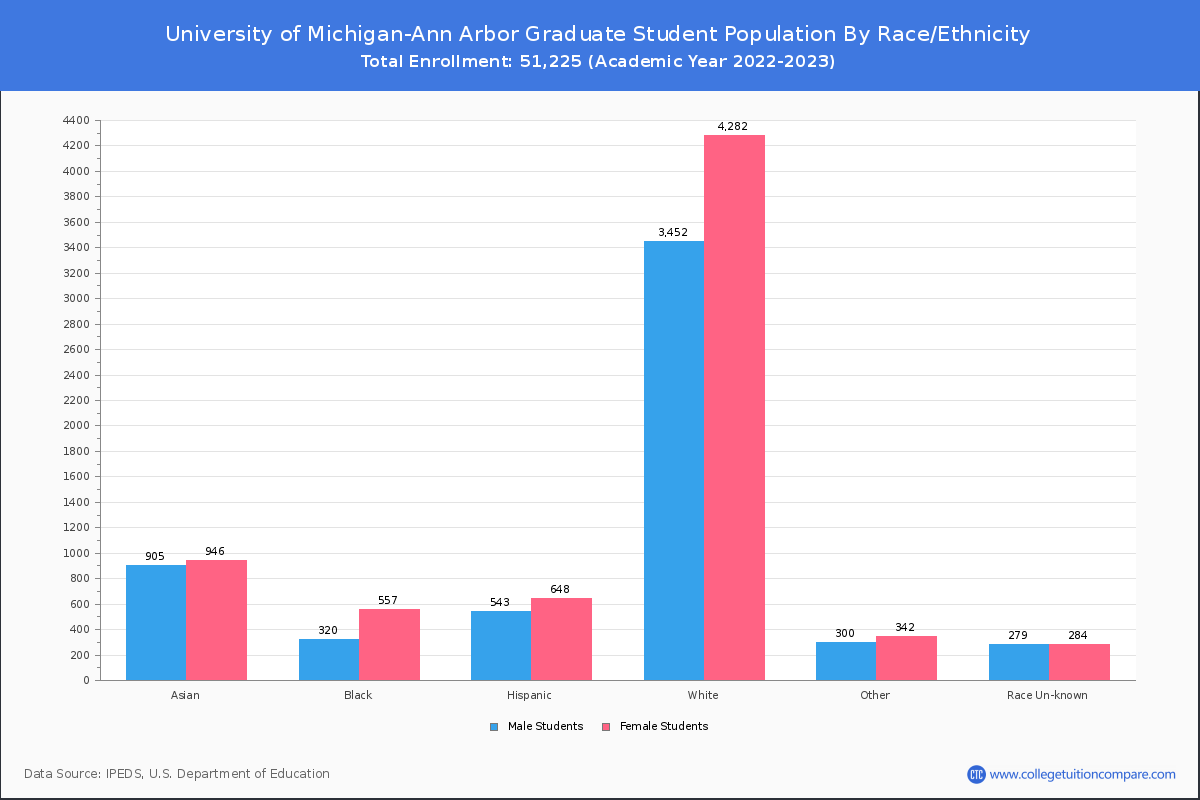
Student Distribution by Race/Ethnicity
By race/ethnicity, 23,947 White, 2,201 Black, and 7,792 Asian students out of a total of 51,225 are attending at University of Michigan-Ann Arbor. Comprehensive enrollment statistic data by race/ethnicity is shown in the next chart (Academic year 2022-2023 data).
| Race | Total | Men | Women |
|---|---|---|---|
| American Indian or Native American | 82 | 35 | 47 |
| Asian | 7,792 | 3,819 | 3,973 |
| Black | 2,201 | 816 | 1,385 |
| Hispanic | 3,918 | 1,750 | 2,168 |
| Native Hawaiian or Other Pacific Islanders | 28 | 15 | 13 |
| White | 23,947 | 10,955 | 12,992 |
| Two or more races | 2,213 | 965 | 1,248 |
| Race Unknown | 2,164 | 1,148 | 1,016 |
| Race | Total | Men | Women |
|---|---|---|---|
| American Indian or Native American | 40 | 16 | 24 |
| Asian | 5,857 | 2,897 | 2,960 |
| Black | 1,334 | 498 | 836 |
| Hispanic | 2,705 | 1,209 | 1,496 |
| Native Hawaiian or Other Pacific Islanders | 18 | 10 | 8 |
| White | 16,653 | 7,745 | 8,908 |
| Two or more races | 1,645 | 712 | 933 |
| Race Unknown | 1,577 | 839 | 738 |
| Race | Total | Men | Women |
|---|---|---|---|
| American Indian or Native American | 0 | 0 | 0 |
| Asian | 171 | 96 | 75 |
| Black | 43 | 17 | 26 |
| Hispanic | 81 | 41 | 40 |
| Native Hawaiian or Other Pacific Islanders | 1 | 1 | 0 |
| White | 483 | 224 | 259 |
| Two or more races | 52 | 22 | 30 |
| Race Unknown | 27 | 15 | 12 |
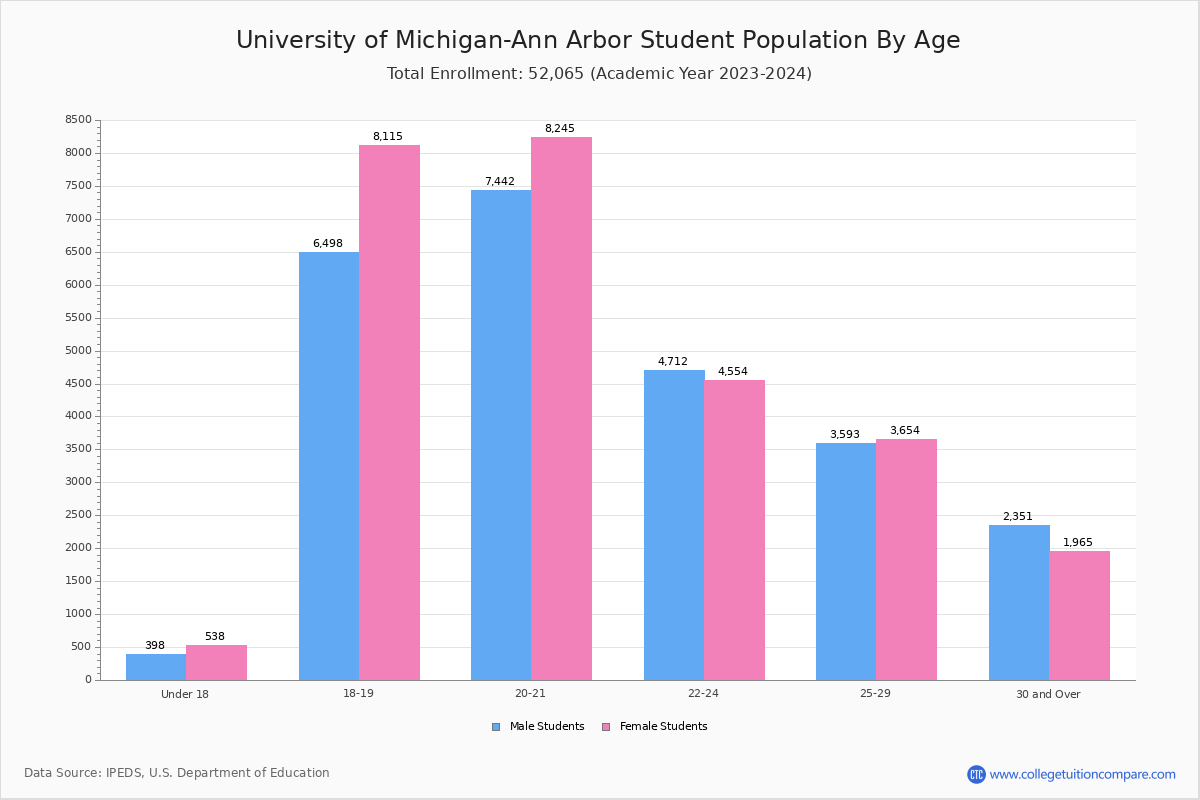
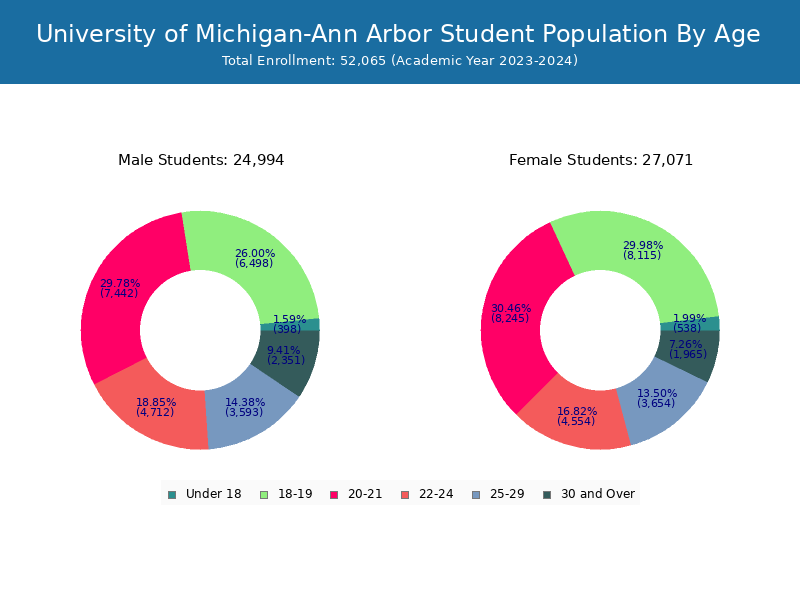
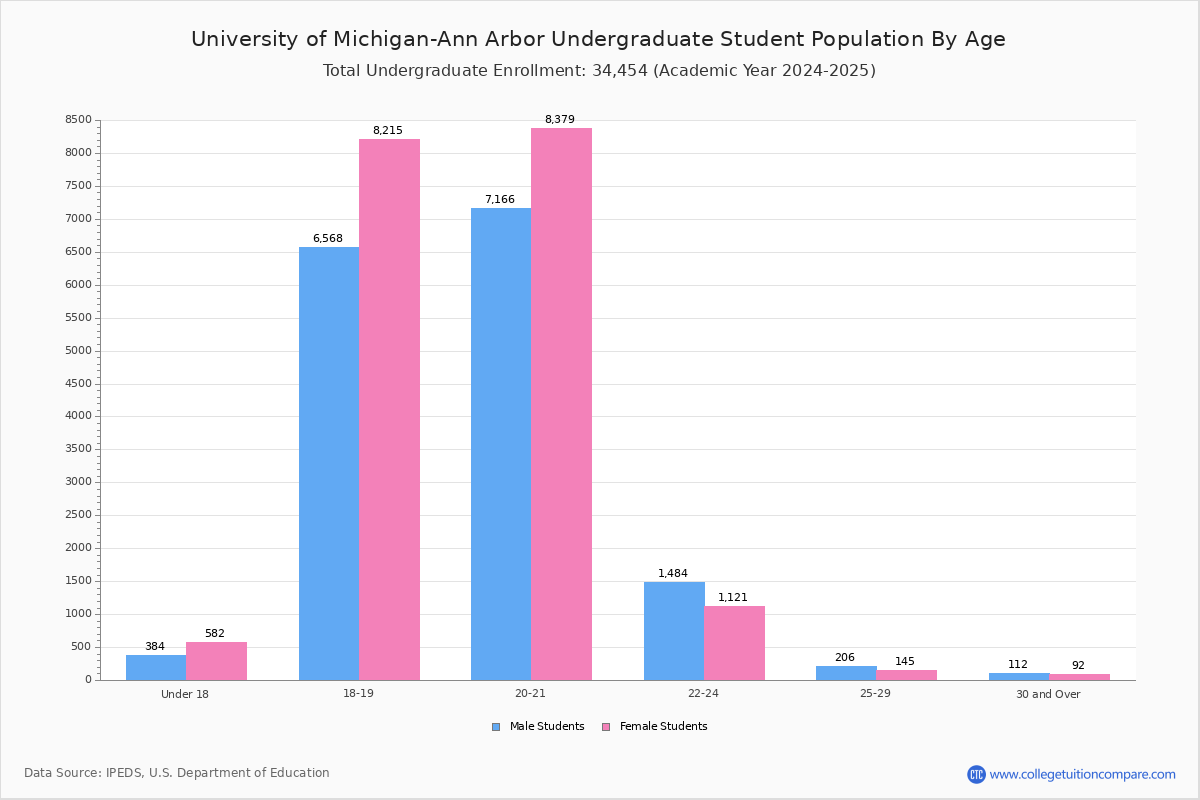
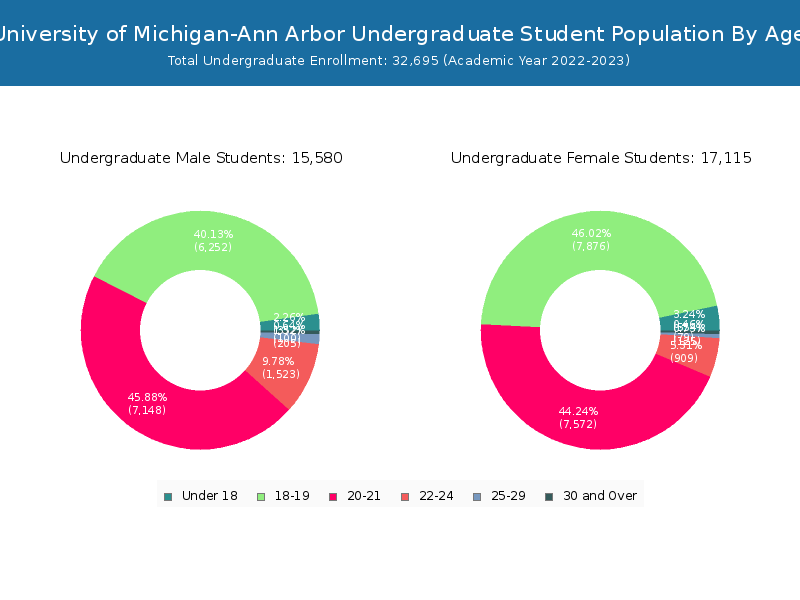
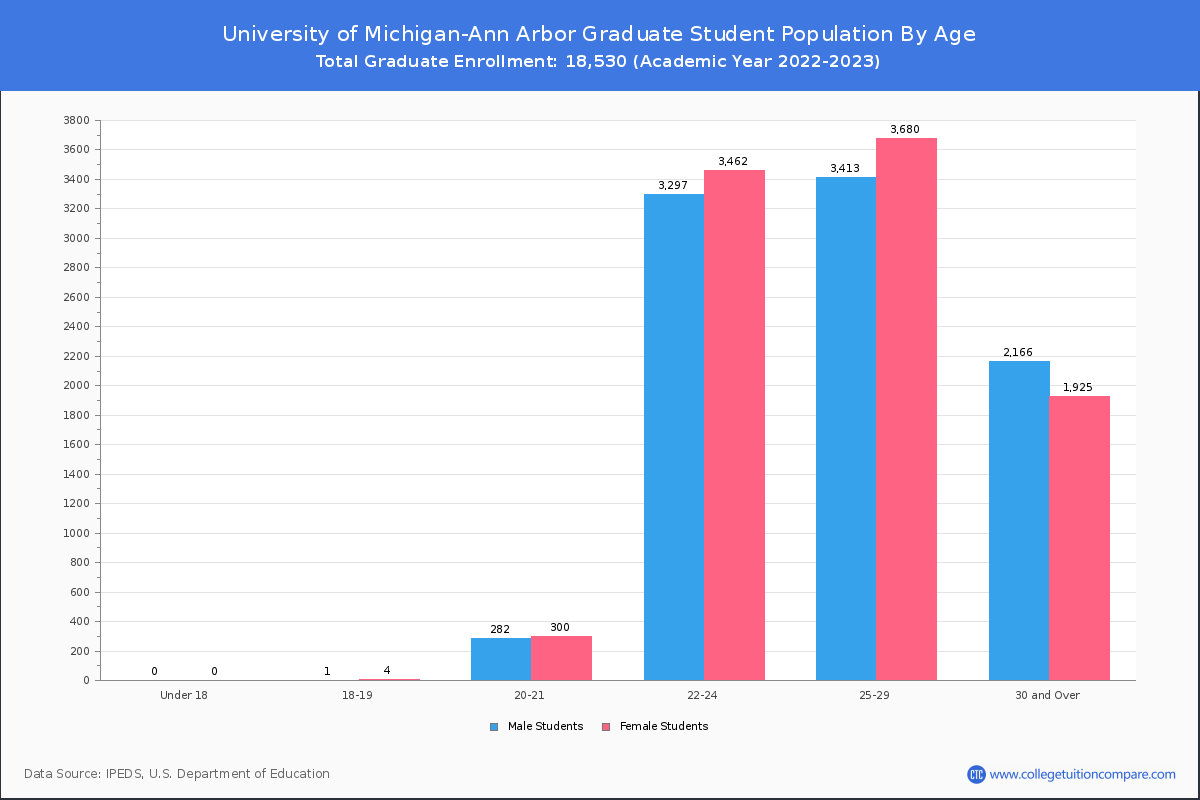
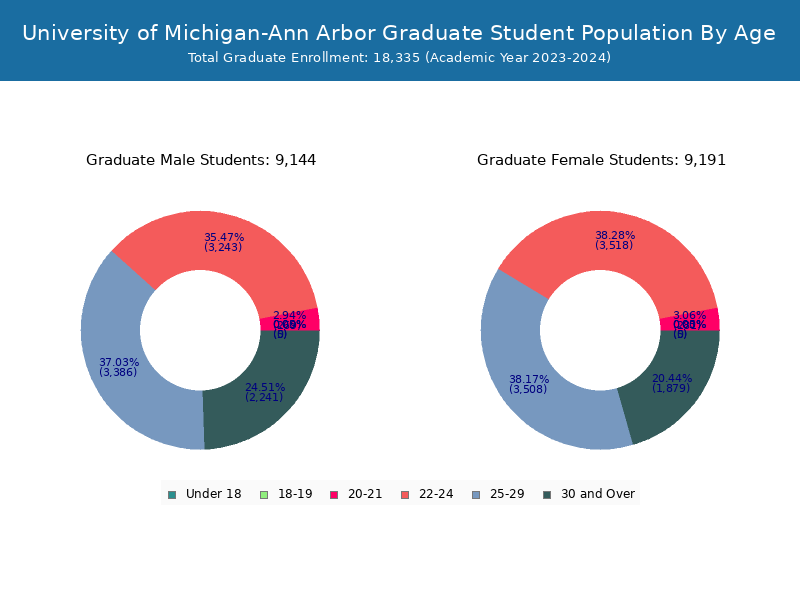
Student Age Distribution
By age, UM-Ann Arbor has 906 students under 18 years old and 14 students over 65 years old. There are 39,532 students under 25 years old, and 11,693 students over 25 years old out of 51,225 total students.
In undergraduate programs, 906 students are younger than 18 and 4 students are older than 65. UM-Ann Arbor has 32,186 undergraduate students aged under 25 and 509 students aged 25 and over.
It has 7,346 graduate students aged under 25 and 11,184 students aged 25 and over.
| Age | Total | Men | Women |
|---|---|---|---|
| Under 18 | 906 | 554 | 352 |
| 18-19 | 14,133 | 7,880 | 6,253 |
| 20-21 | 15,302 | 7,872 | 7,430 |
| 22-24 | 9,191 | 4,371 | 4,820 |
| 25-29 | 7,423 | 3,805 | 3,618 |
| 30-34 | 2,646 | 1,251 | 1,395 |
| 35-39 | 861 | 387 | 474 |
| 40-49 | 591 | 281 | 310 |
| 50-64 | 158 | 79 | 79 |
| Over 65 | 14 | 6 | 8 |
| Age | Total | Men | Women |
|---|---|---|---|
| Under 18 | 906 | 554 | 352 |
| 18-19 | 14,128 | 7,876 | 6,252 |
| 20-21 | 14,720 | 7,572 | 7,148 |
| 22-24 | 2,432 | 909 | 1,523 |
| 25-29 | 330 | 125 | 205 |
| 30-34 | 101 | 42 | 59 |
| 35-39 | 39 | 9 | 30 |
| 40-49 | 26 | 18 | 8 |
| 50-64 | 9 | 7 | 2 |
| Over 65 | 4 | 3 | 1 |
| Age | Total | Men | Women |
|---|
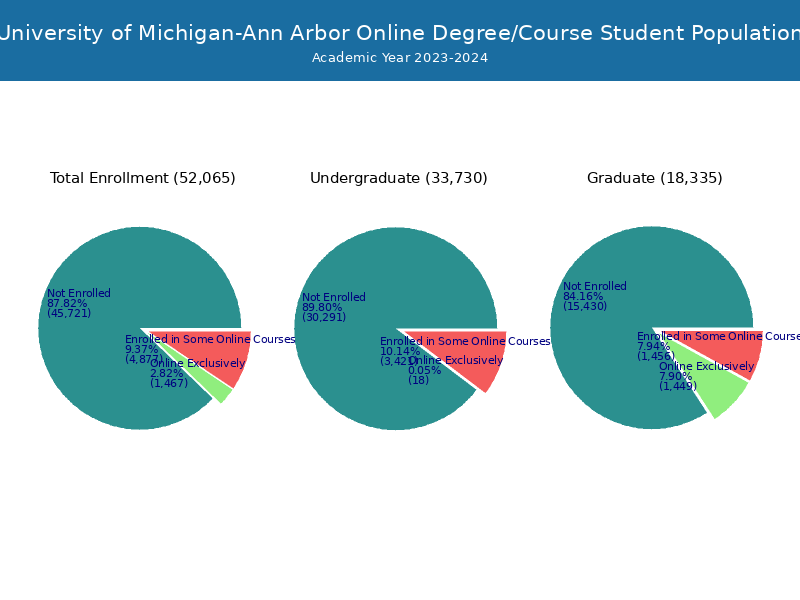
Online Student Enrollment
Distance learning, also called online education, is very attractive to students, especially who want to continue education and work in field. At University of Michigan-Ann Arbor, 1,525 students are enrolled exclusively in online courses and 5,411 students are enrolled in some online courses.
568 students lived in Michigan or jurisdiction in which the school is located are enrolled exclusively in online courses and 957 students live in other State or outside of the United States.
| All Students | Enrolled Exclusively Online Courses | Enrolled in Some Online Courses | |
|---|---|---|---|
| All Students | 51,225 | 1,525 | 5,411 |
| Undergraduate | 32,695 | 31 | 3,274 |
| Graduate | 18,530 | 1,494 | 2,137 |
| Michigan Residents | Other States in U.S. | Outside of U.S. | |
|---|---|---|---|
| All Students | 568 | 652 | 305 |
| Undergraduate | 22 | 7 | 2 |
| Graduate | 546 | 645 | 303 |
Transfer-in Students (Undergraduate)
Among 32,695 enrolled in undergraduate programs, 1,342 students have transferred-in from other institutions. The percentage of transfer-in students is 4.10%.1,306 students have transferred in as full-time status and 36 students transferred in as part-time status.
| Number of Students | |
|---|---|
| Regular Full-time | 30,013 |
| Transfer-in Full-time | 1,306 |
| Regular Part-time | 1,340 |
| Transfer-in Part-time | 36 |