Student Population by Gender
University of Maryland-College Park has a total of 40,792 enrolled students for the academic year 2022-2023. 30,353 students have enrolled in undergraduate programs and 10,439 students joined graduate programs.
By gender, 20,762 male and 20,030 female students (the male-female ratio is 51:49) are attending the school. The gender distribution is based on the 2022-2023 data.
| Total | Undergraduate | Graduate | |
|---|---|---|---|
| Total | 40,792 | 30,353 | 10,439 |
| Men | 20,762 | 15,413 | 5,349 |
| Women | 20,030 | 14,940 | 5,090 |
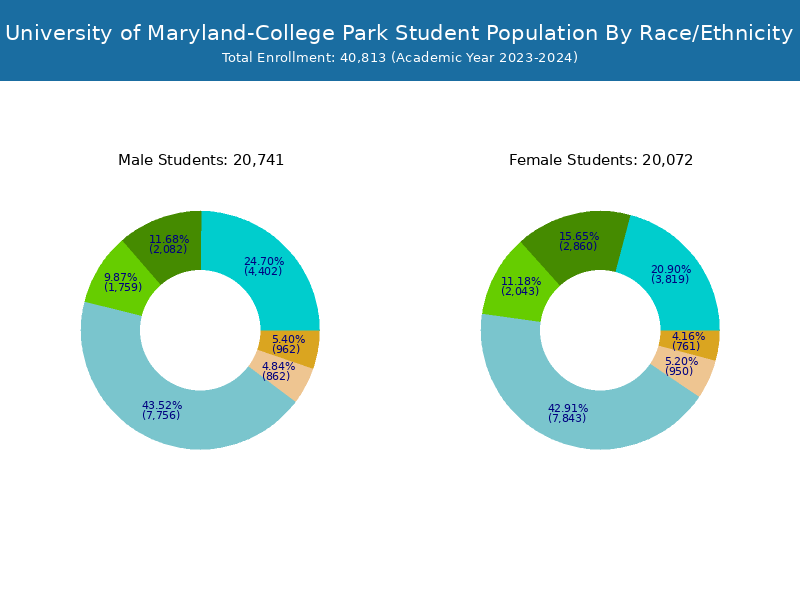
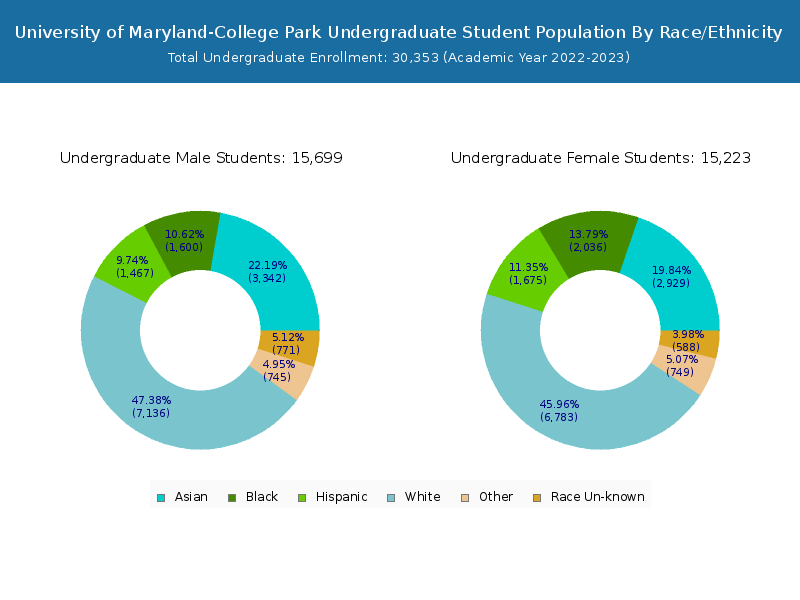
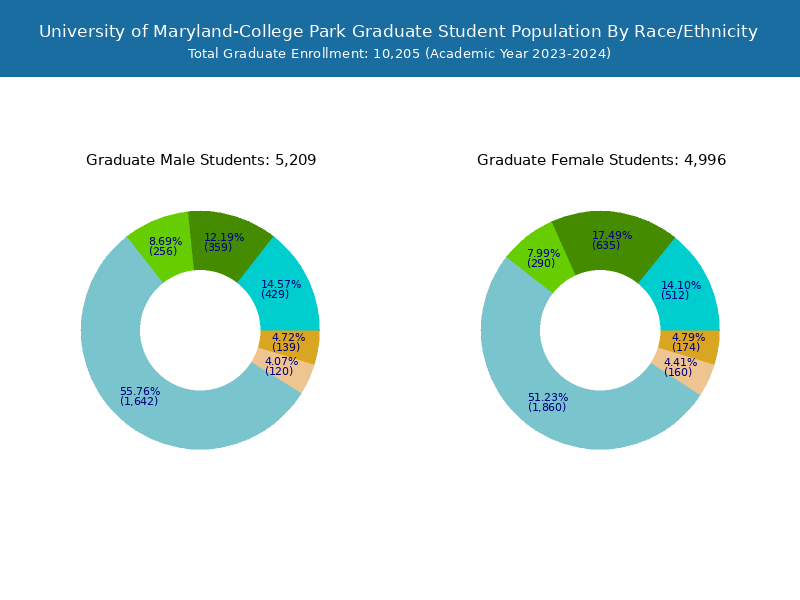
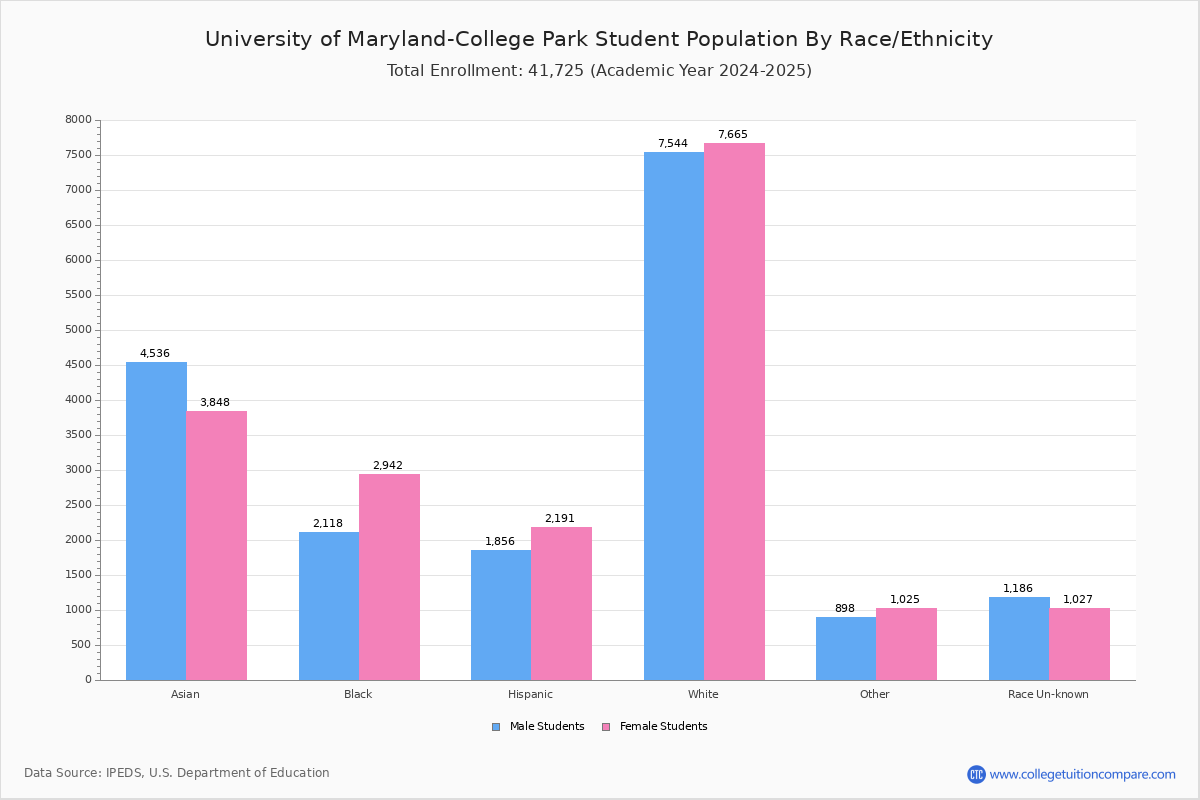
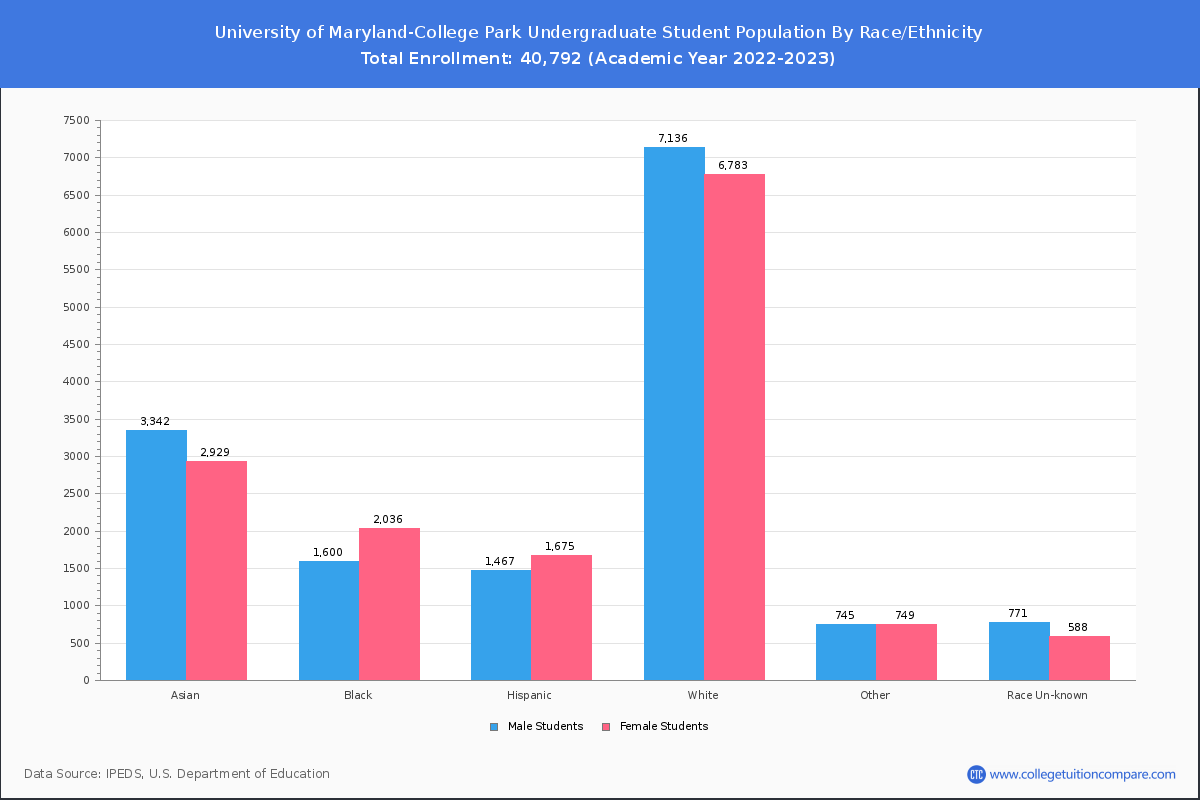
Student Distribution by Race/Ethnicity
By race/ethnicity, 16,315 White, 4,779 Black, and 7,734 Asian students out of a total of 40,792 are attending at University of Maryland-College Park. Comprehensive enrollment statistic data by race/ethnicity is shown in the next chart (Academic year 2022-2023 data).
| Race | Total | Men | Women |
|---|---|---|---|
| American Indian or Native American | 41 | 20 | 21 |
| Asian | 7,734 | 4,092 | 3,642 |
| Black | 4,779 | 2,042 | 2,737 |
| Hispanic | 3,666 | 1,660 | 2,006 |
| Native Hawaiian or Other Pacific Islanders | 24 | 13 | 11 |
| White | 16,315 | 8,263 | 8,052 |
| Two or more races | 1,737 | 827 | 910 |
| Race Unknown | 1,719 | 959 | 760 |
| Race | Total | Men | Women |
|---|---|---|---|
| American Indian or Native American | 33 | 19 | 14 |
| Asian | 6,772 | 3,653 | 3,119 |
| Black | 3,833 | 1,683 | 2,150 |
| Hispanic | 3,131 | 1,426 | 1,705 |
| Native Hawaiian or Other Pacific Islanders | 16 | 8 | 8 |
| White | 12,628 | 6,463 | 6,165 |
| Two or more races | 1,456 | 707 | 749 |
| Race Unknown | 1,367 | 790 | 577 |
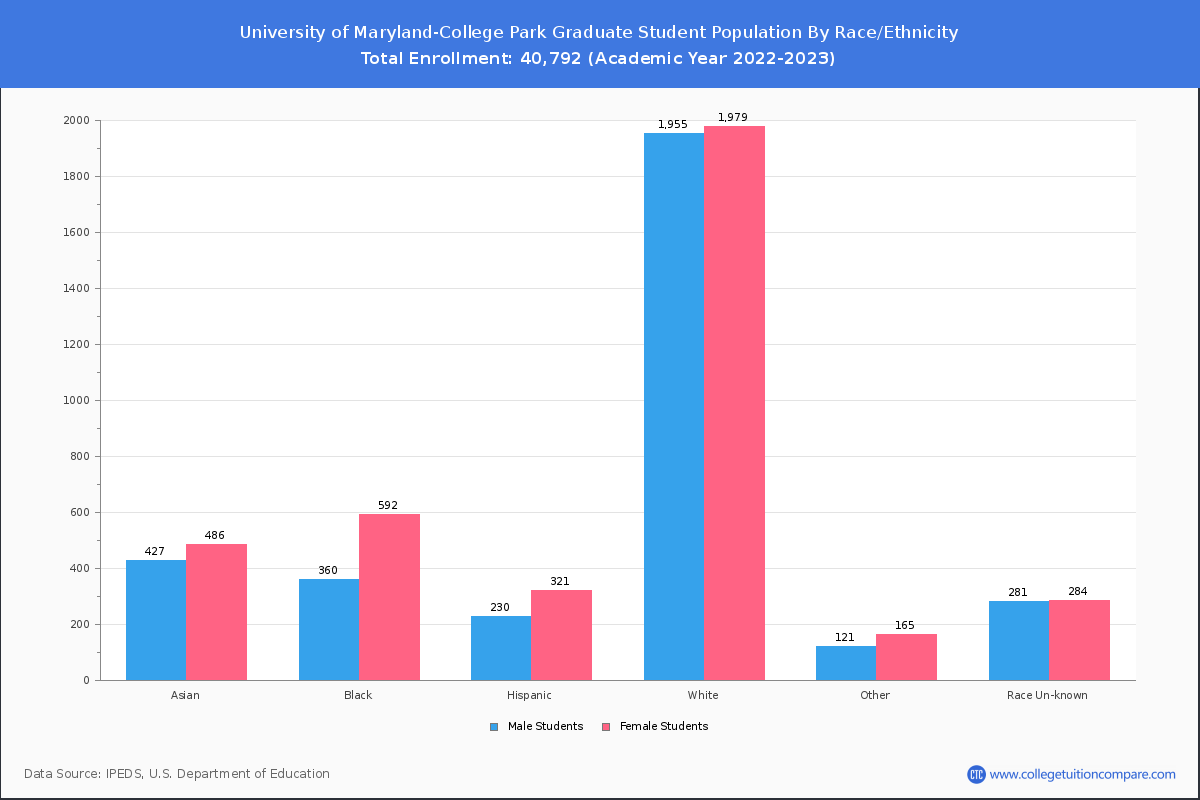
| Race | Total | Men | Women |
|---|---|---|---|
| American Indian or Native American | 2 | 2 | 0 |
| Asian | 347 | 180 | 167 |
| Black | 325 | 165 | 160 |
| Hispanic | 316 | 160 | 156 |
| Native Hawaiian or Other Pacific Islanders | 0 | 0 | 0 |
| White | 744 | 408 | 336 |
| Two or more races | 108 | 46 | 62 |
| Race Unknown | 47 | 34 | 13 |
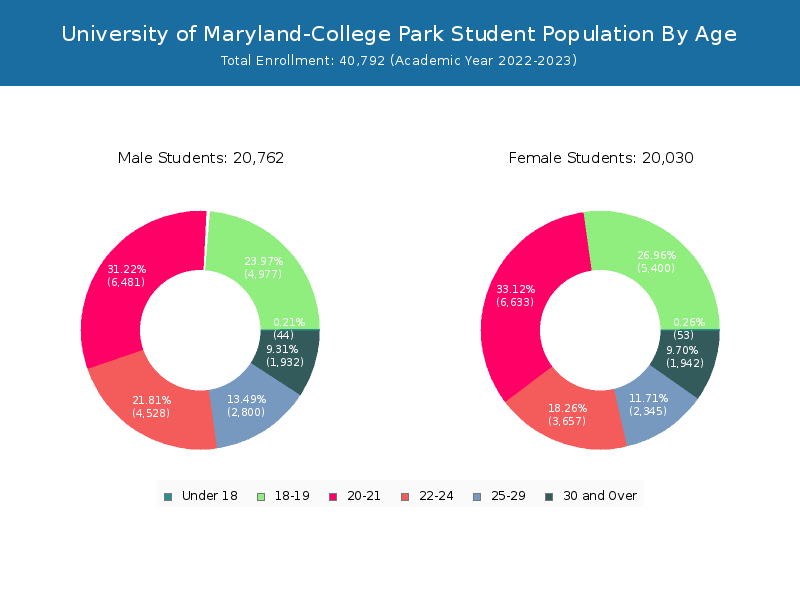
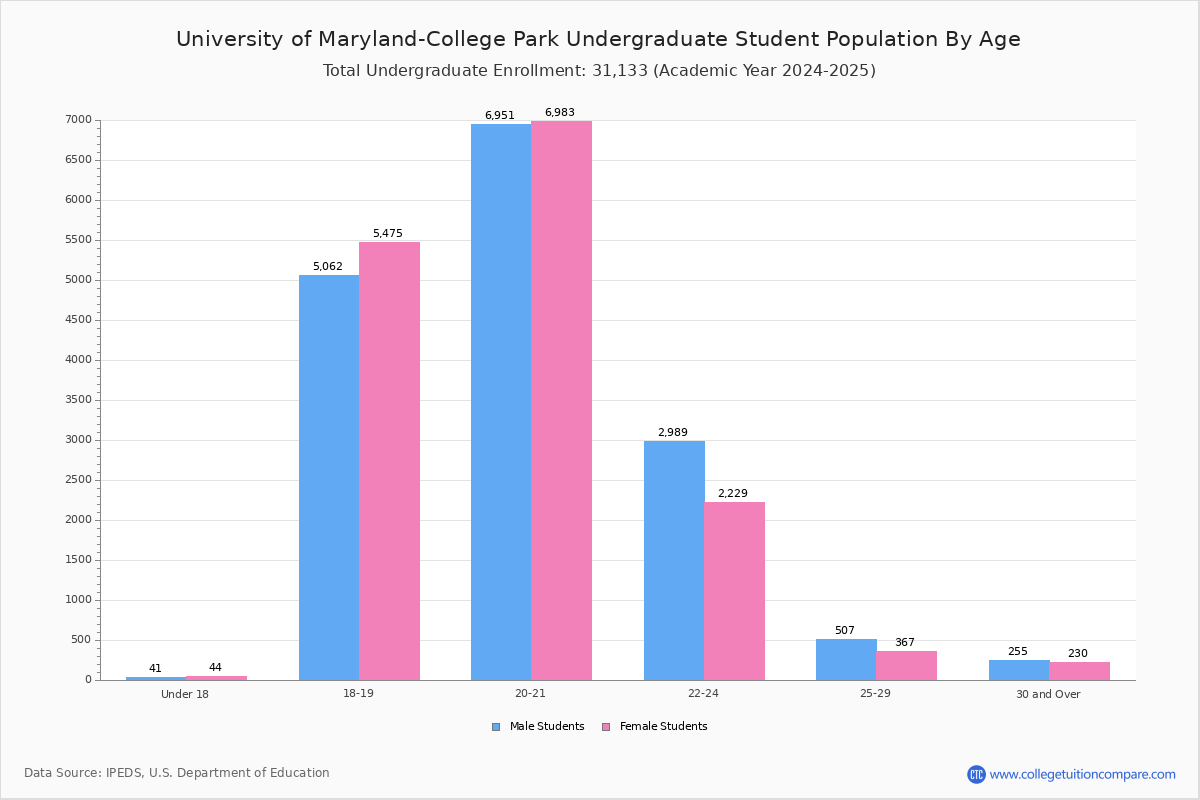
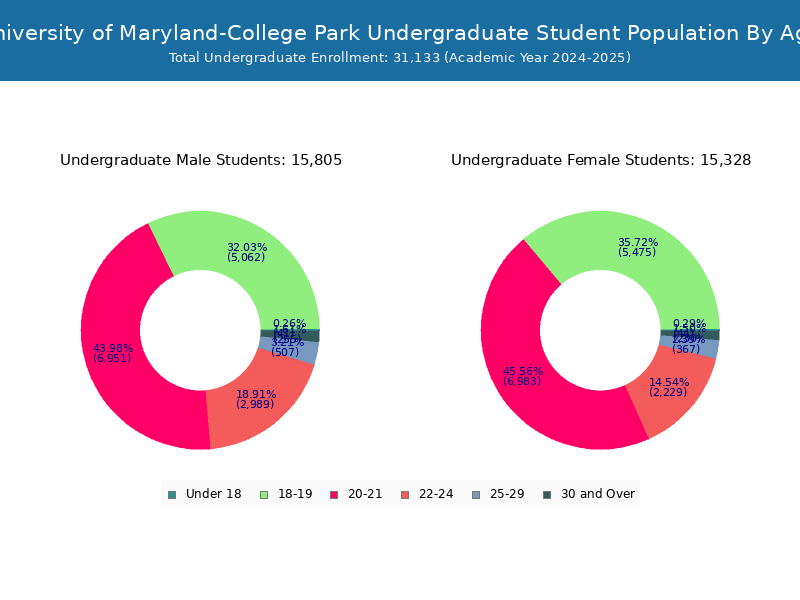
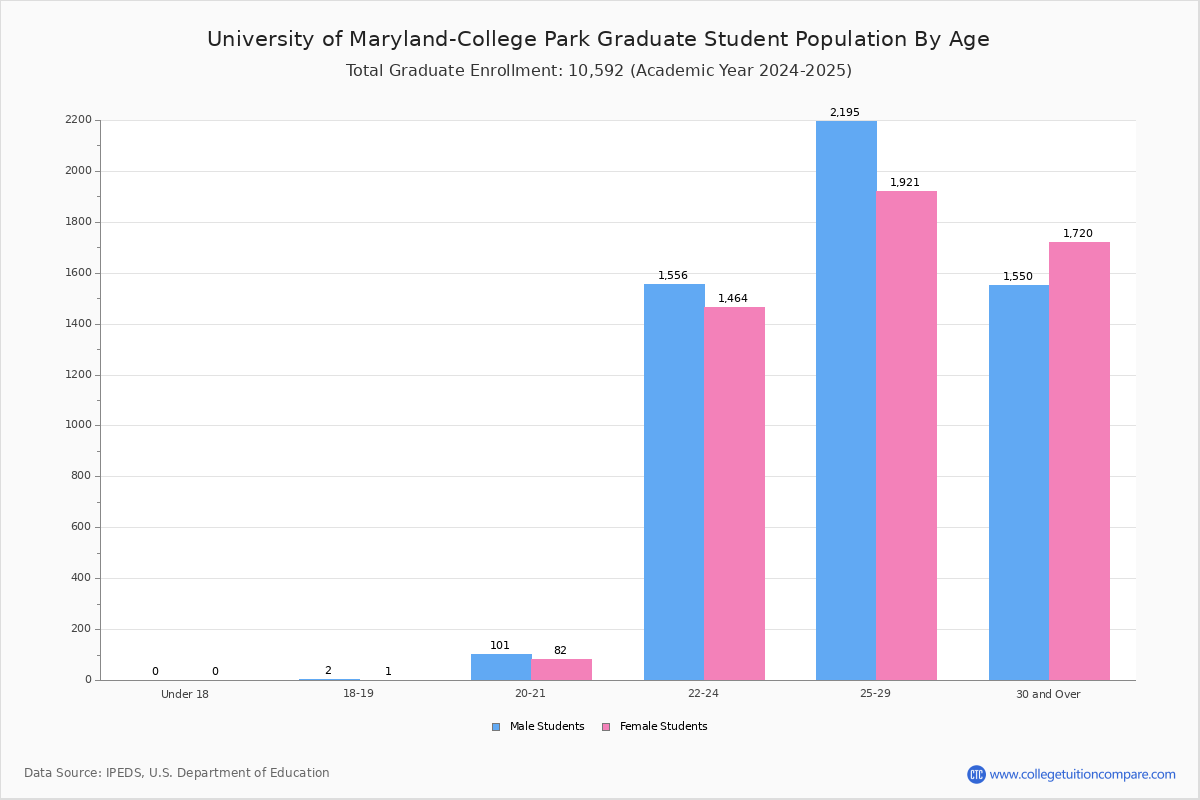
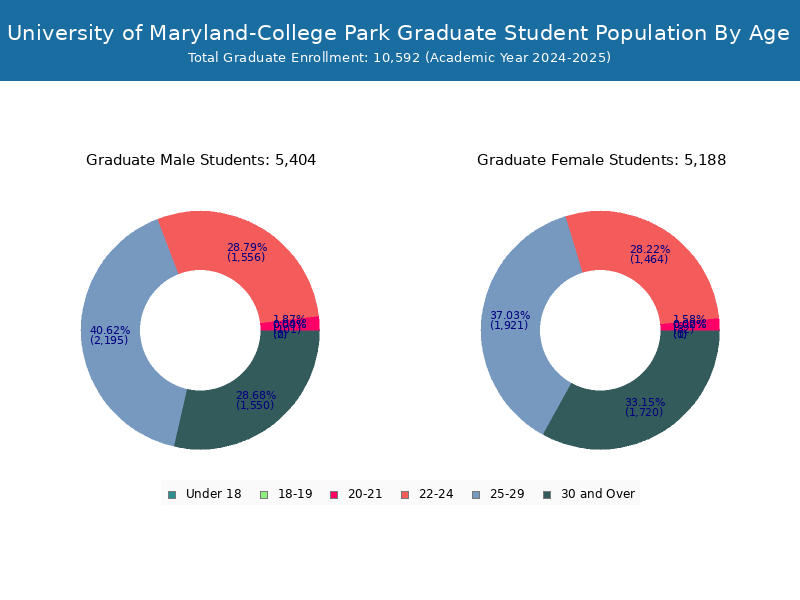
Student Age Distribution
By age, UMD has 97 students under 18 years old and 106 students over 65 years old. There are 31,773 students under 25 years old, and 9,019 students over 25 years old out of 40,792 total students.
In undergraduate programs, 97 students are younger than 18 and 20 students are older than 65. UMD has 28,759 undergraduate students aged under 25 and 1,594 students aged 25 and over.
It has 3,014 graduate students aged under 25 and 7,425 students aged 25 and over.
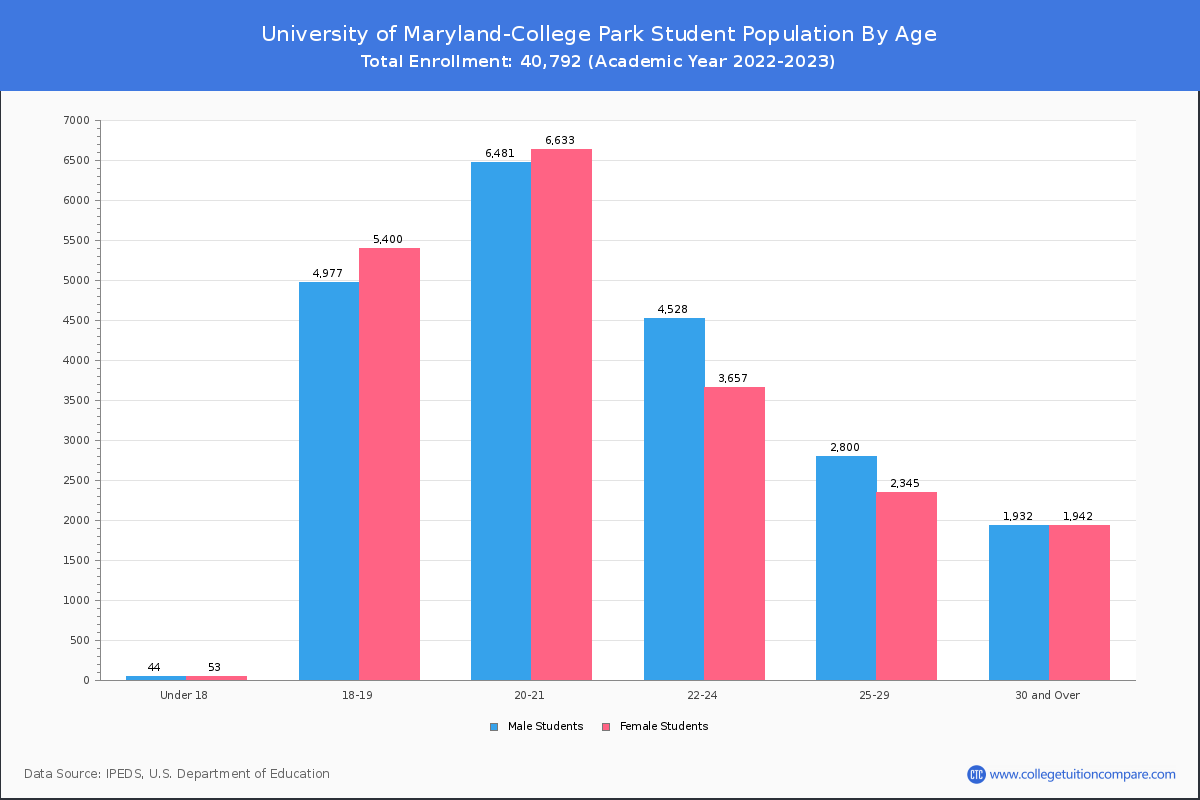
| Age | Total | Men | Women |
|---|---|---|---|
| Under 18 | 97 | 53 | 44 |
| 18-19 | 10,377 | 5,400 | 4,977 |
| 20-21 | 13,114 | 6,633 | 6,481 |
| 22-24 | 8,185 | 3,657 | 4,528 |
| 25-29 | 5,145 | 2,345 | 2,800 |
| 30-34 | 1,920 | 921 | 999 |
| 35-39 | 798 | 413 | 385 |
| 40-49 | 750 | 393 | 357 |
| 50-64 | 300 | 168 | 132 |
| Over 65 | 106 | 47 | 59 |
| Age | Total | Men | Women |
|---|---|---|---|
| Under 18 | 97 | 53 | 44 |
| 18-19 | 10,373 | 5,399 | 4,974 |
| 20-21 | 13,010 | 6,587 | 6,423 |
| 22-24 | 5,279 | 2,222 | 3,057 |
| 25-29 | 1,021 | 427 | 594 |
| 30-34 | 311 | 134 | 177 |
| 35-39 | 109 | 53 | 56 |
| 40-49 | 96 | 40 | 56 |
| 50-64 | 37 | 16 | 21 |
| Over 65 | 20 | 9 | 11 |
| Age | Total | Men | Women |
|---|
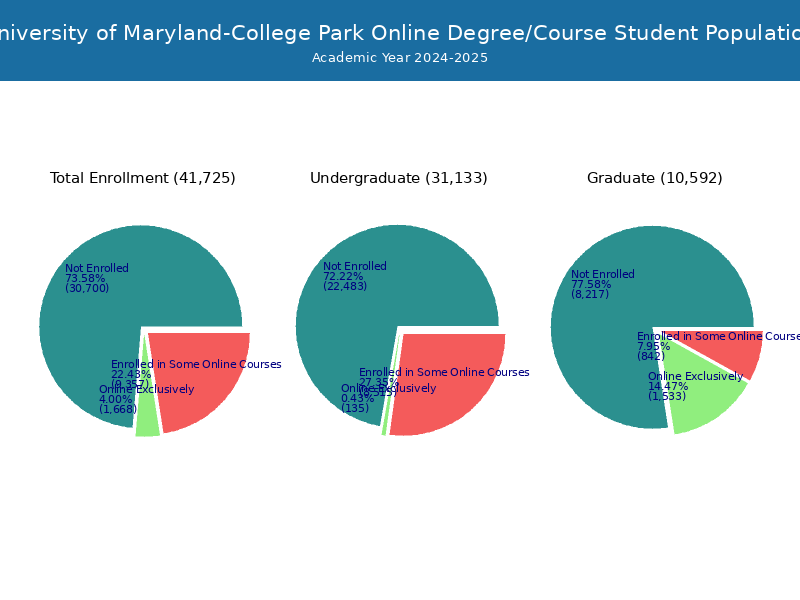
Online Student Enrollment
Distance learning, also called online education, is very attractive to students, especially who want to continue education and work in field. At University of Maryland-College Park, 1,516 students are enrolled exclusively in online courses and 9,383 students are enrolled in some online courses.
1,020 students lived in Maryland or jurisdiction in which the school is located are enrolled exclusively in online courses and 496 students live in other State or outside of the United States.
| All Students | Enrolled Exclusively Online Courses | Enrolled in Some Online Courses | |
|---|---|---|---|
| All Students | 40,792 | 1,516 | 9,383 |
| Undergraduate | 30,353 | 243 | 8,253 |
| Graduate | 10,439 | 1,273 | 1,130 |
| Maryland Residents | Other States in U.S. | Outside of U.S. | |
|---|---|---|---|
| All Students | 1,020 | 454 | 42 |
| Undergraduate | 229 | 14 | 0 |
| Graduate | 791 | 440 | 42 |
Transfer-in Students (Undergraduate)
Among 30,353 enrolled in undergraduate programs, 1,993 students have transferred-in from other institutions. The percentage of transfer-in students is 6.57%.1,783 students have transferred in as full-time status and 210 students transferred in as part-time status.
| Number of Students | |
|---|---|
| Regular Full-time | 26,286 |
| Transfer-in Full-time | 1,783 |
| Regular Part-time | 2,074 |
| Transfer-in Part-time | 210 |