Student Population by Gender
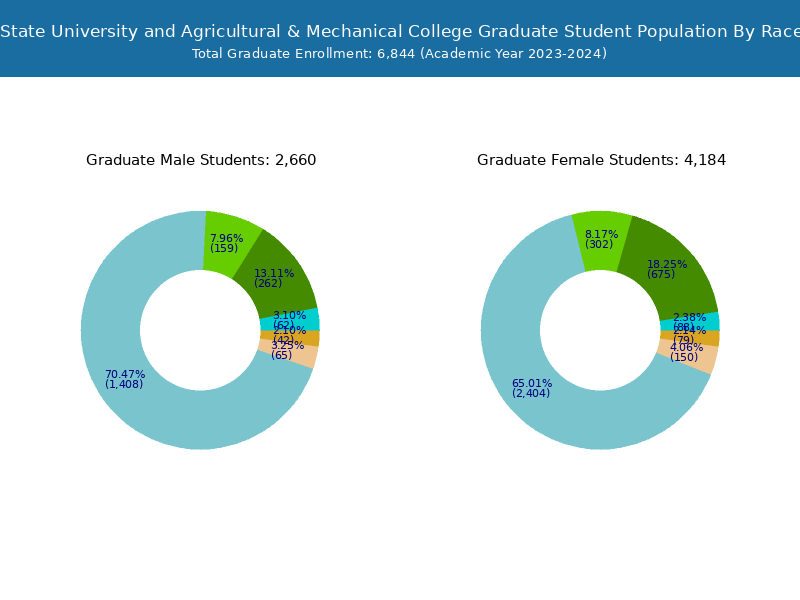
Louisiana State University and Agricultural & Mechanical College has a total of 37,348 enrolled students for the academic year 2022-2023. 30,952 students have enrolled in undergraduate programs and 6,396 students joined graduate programs.
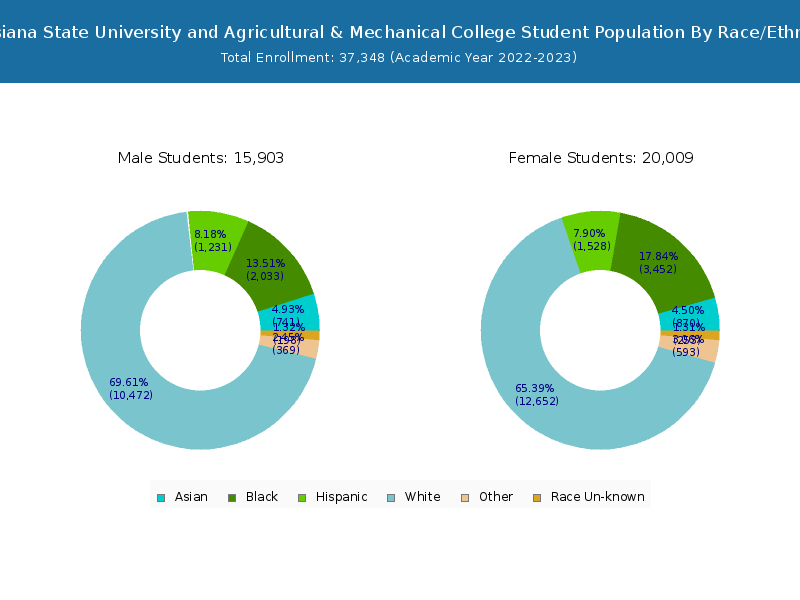
By gender, 16,394 male and 20,954 female students (the male-female ratio is 44:56) are attending the school. The gender distribution is based on the 2022-2023 data.
| Total | Undergraduate | Graduate | |
|---|---|---|---|
| Total | 37,348 | 30,952 | 6,396 |
| Men | 16,394 | 13,896 | 2,498 |
| Women | 20,954 | 17,056 | 3,898 |

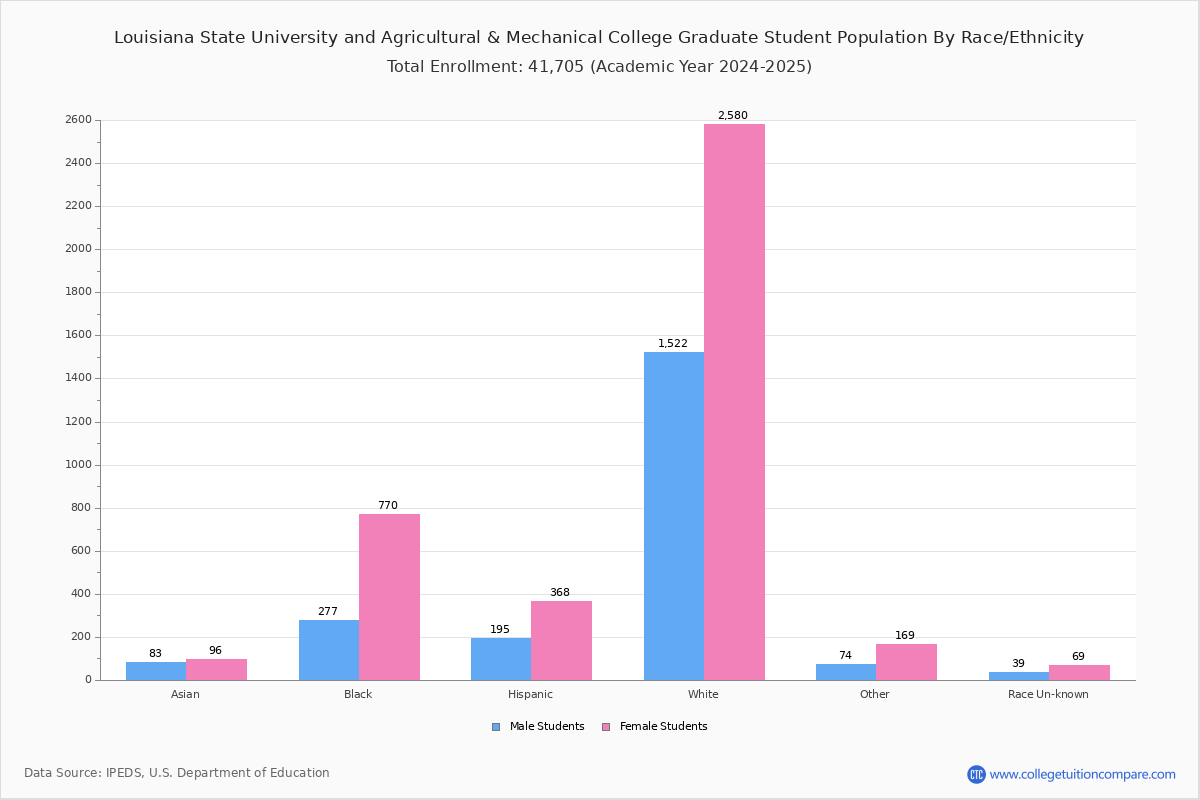
Student Distribution by Race/Ethnicity
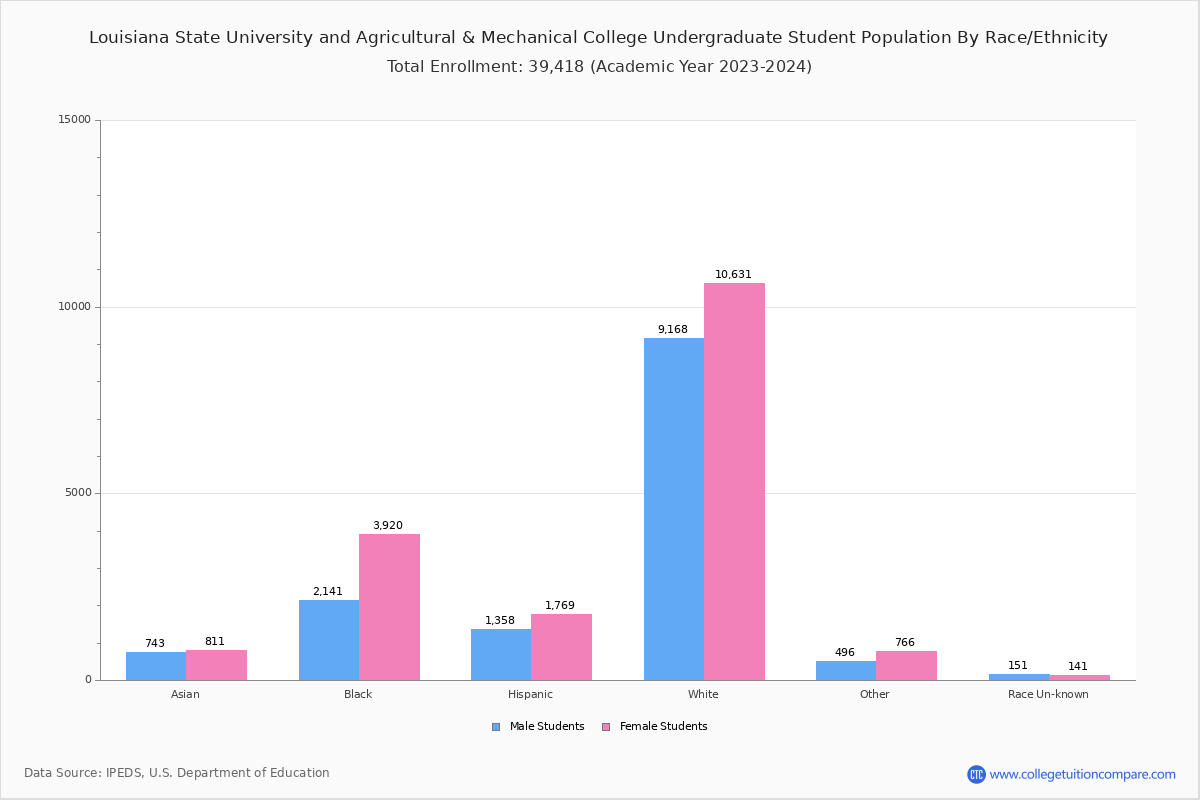
By race/ethnicity, 23,004 White, 6,257 Black, and 1,658 Asian students out of a total of 37,348 are attending at Louisiana State University and Agricultural & Mechanical College. Comprehensive enrollment statistic data by race/ethnicity is shown in the next chart (Academic year 2022-2023 data).
| Race | Total | Men | Women |
|---|---|---|---|
| American Indian or Native American | 186 | 83 | 103 |
| Asian | 1,658 | 758 | 900 |
| Black | 6,257 | 2,281 | 3,976 |
| Hispanic | 3,147 | 1,382 | 1,765 |
| Native Hawaiian or Other Pacific Islanders | 33 | 16 | 17 |
| White | 23,004 | 10,406 | 12,598 |
| Two or more races | 1,048 | 409 | 639 |
| Race Unknown | 444 | 196 | 248 |
| Race | Total | Men | Women |
|---|---|---|---|
| American Indian or Native American | 166 | 75 | 91 |
| Asian | 1,508 | 689 | 819 |
| Black | 5,399 | 2,041 | 3,358 |
| Hispanic | 2,768 | 1,228 | 1,540 |
| Native Hawaiian or Other Pacific Islanders | 26 | 12 | 14 |
| White | 19,404 | 9,067 | 10,337 |
| Two or more races | 894 | 360 | 534 |
| Race Unknown | 281 | 145 | 136 |
| Race | Total | Men | Women |
|---|---|---|---|
| American Indian or Native American | 7 | 5 | 2 |
| Asian | 37 | 19 | 18 |
| Black | 191 | 68 | 123 |
| Hispanic | 129 | 53 | 76 |
| Native Hawaiian or Other Pacific Islanders | 2 | 1 | 1 |
| White | 546 | 301 | 245 |
| Two or more races | 41 | 19 | 22 |
| Race Unknown | 12 | 7 | 5 |
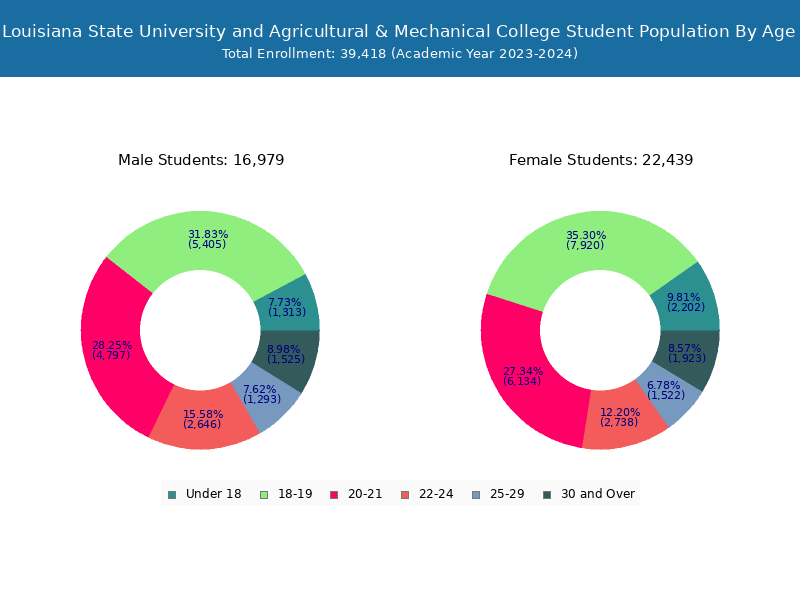
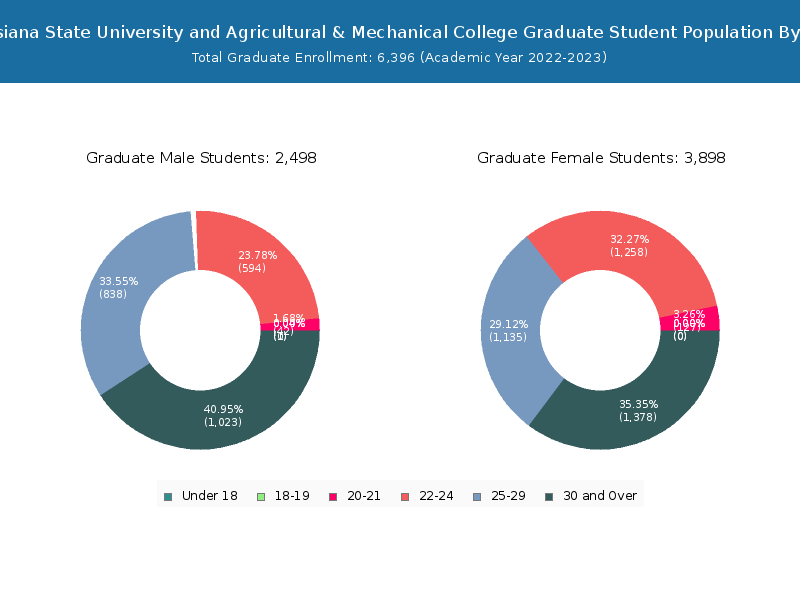
Student Age Distribution
By age, LSU has 3,388 students under 18 years old and 28 students over 65 years old. There are 31,643 students under 25 years old, and 5,705 students over 25 years old out of 37,348 total students.
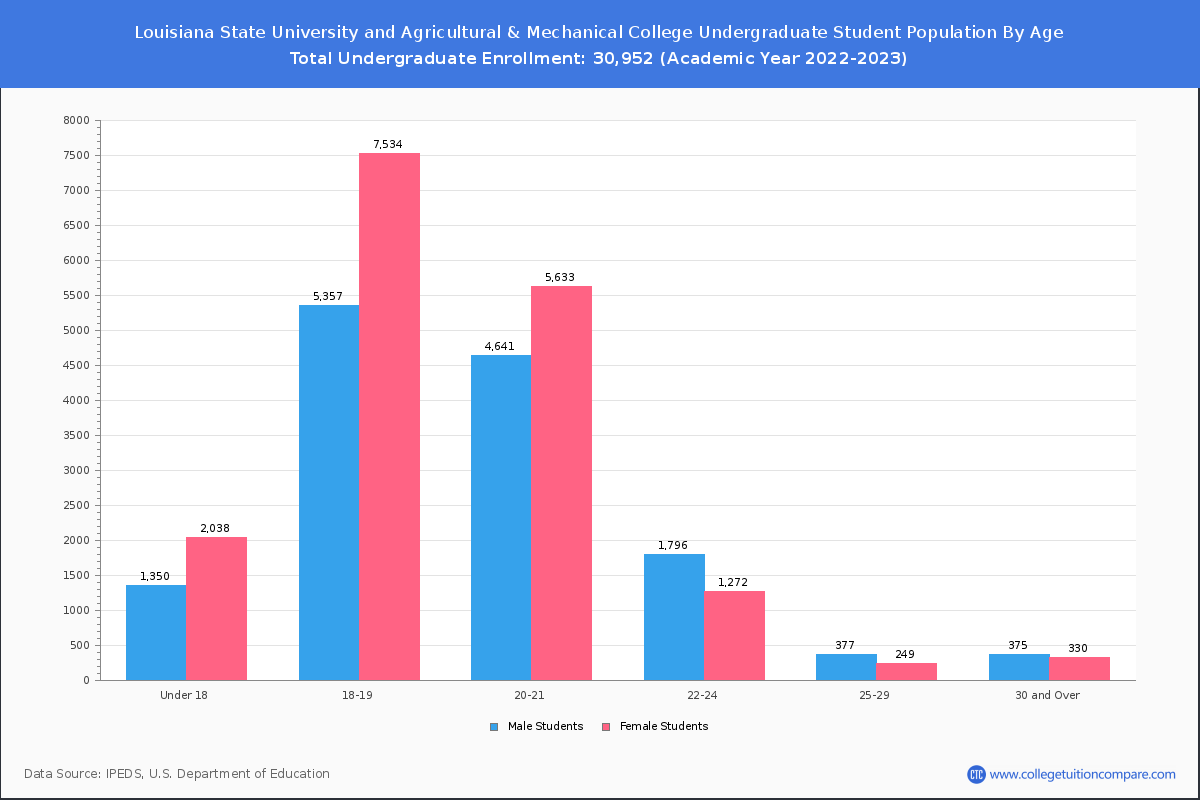
In undergraduate programs, 3,388 students are younger than 18 and 9 students are older than 65. LSU has 29,621 undergraduate students aged under 25 and 1,331 students aged 25 and over.
It has 2,022 graduate students aged under 25 and 4,374 students aged 25 and over.
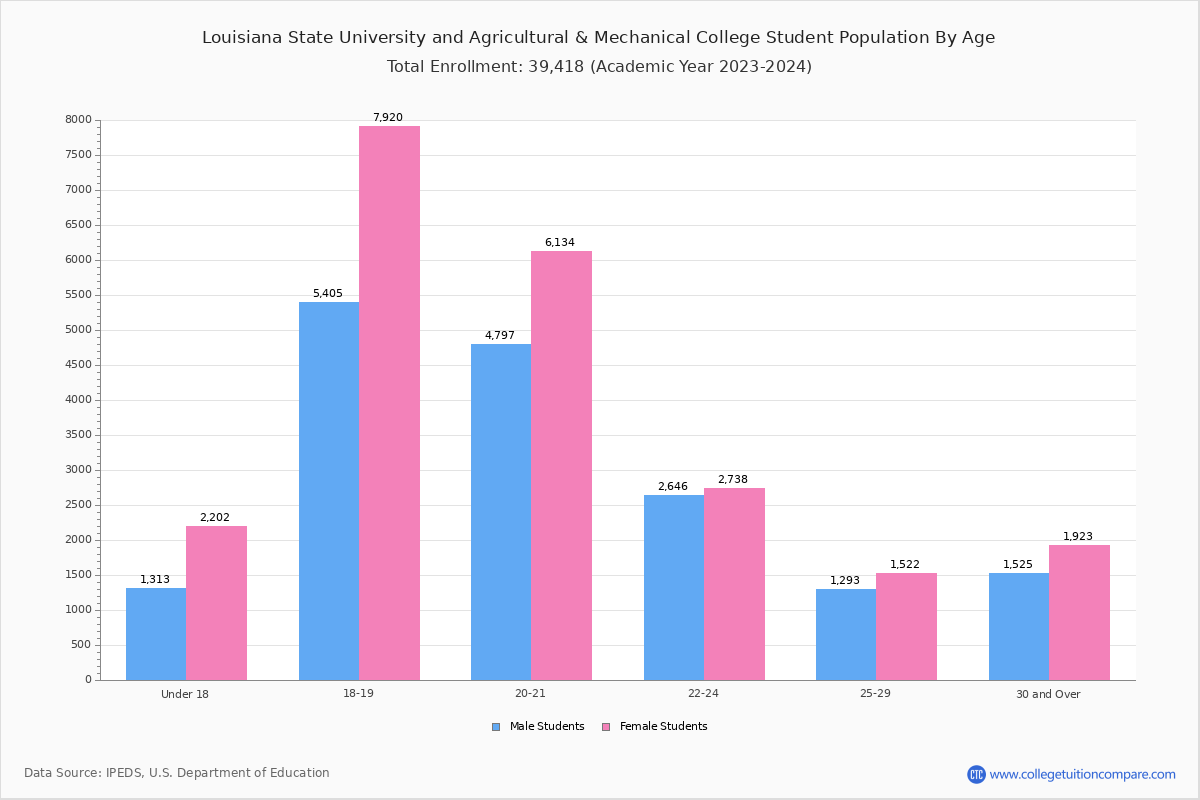
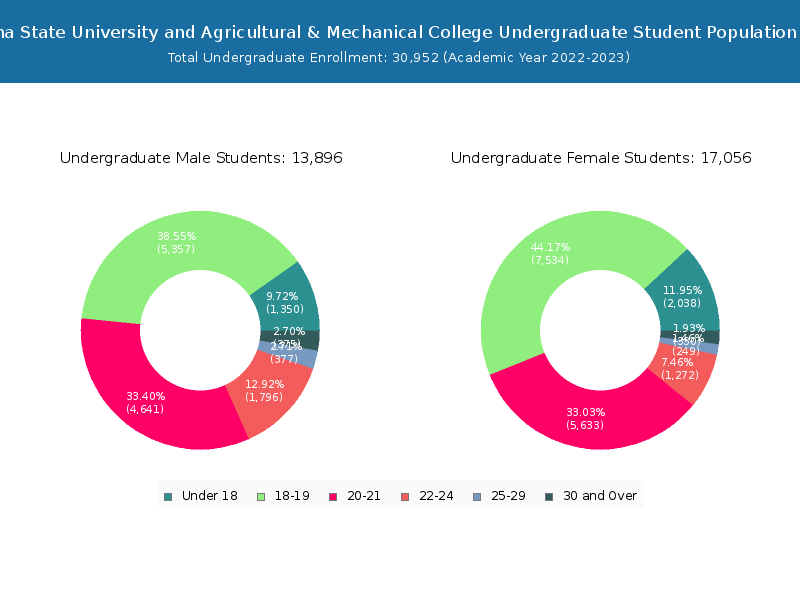
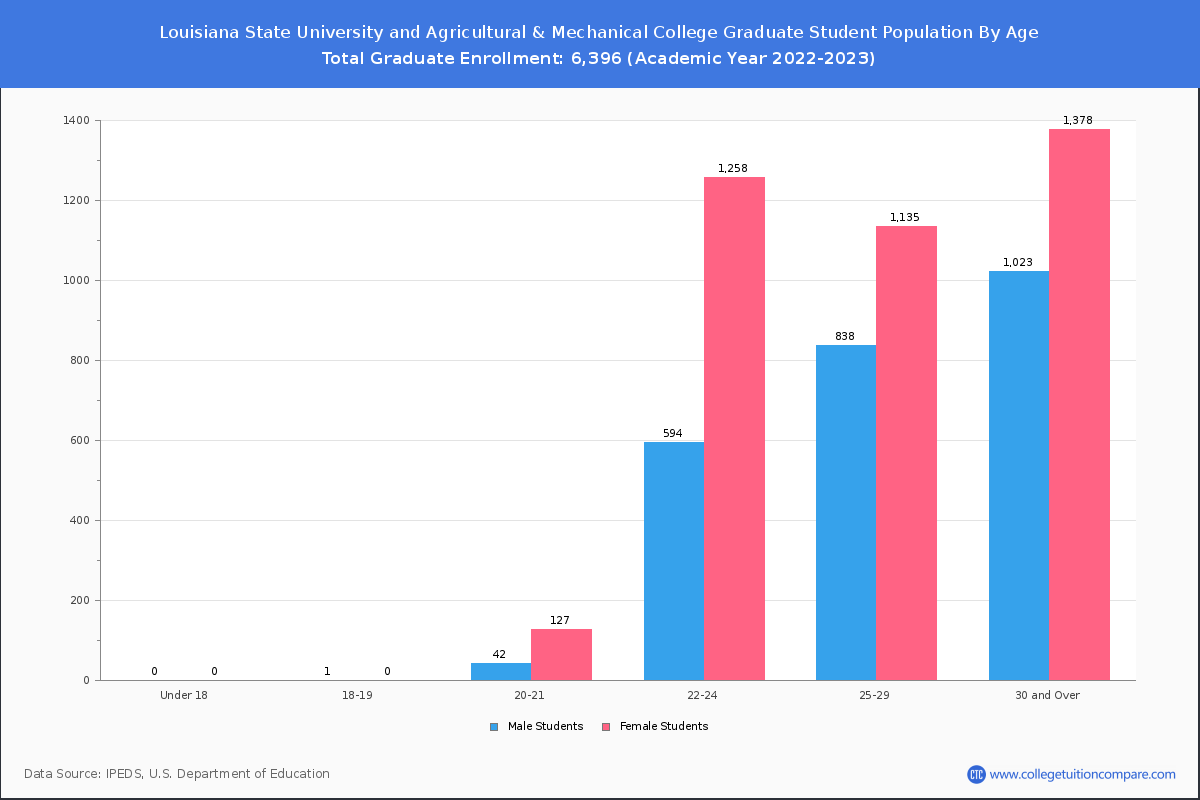
| Age | Total | Men | Women |
|---|---|---|---|
| Under 18 | 3,388 | 2,038 | 1,350 |
| 18-19 | 12,892 | 7,534 | 5,358 |
| 20-21 | 10,443 | 5,760 | 4,683 |
| 22-24 | 4,920 | 2,530 | 2,390 |
| 25-29 | 2,599 | 1,384 | 1,215 |
| 30-34 | 1,366 | 685 | 681 |
| 35-39 | 710 | 395 | 315 |
| 40-49 | 731 | 443 | 288 |
| 50-64 | 271 | 172 | 99 |
| Over 65 | 28 | 13 | 15 |
| Age | Total | Men | Women |
|---|---|---|---|
| Under 18 | 3,388 | 2,038 | 1,350 |
| 18-19 | 12,891 | 7,534 | 5,357 |
| 20-21 | 10,274 | 5,633 | 4,641 |
| 22-24 | 3,068 | 1,272 | 1,796 |
| 25-29 | 626 | 249 | 377 |
| 30-34 | 301 | 128 | 173 |
| 35-39 | 173 | 83 | 90 |
| 40-49 | 163 | 80 | 83 |
| 50-64 | 59 | 35 | 24 |
| Over 65 | 9 | 4 | 5 |
| Age | Total | Men | Women |
|---|
Online Student Enrollment
Distance learning, also called online education, is very attractive to students, especially who want to continue education and work in field. At Louisiana State University and Agricultural & Mechanical College, 3,031 students are enrolled exclusively in online courses and 15,034 students are enrolled in some online courses.
1,198 students lived in Louisiana or jurisdiction in which the school is located are enrolled exclusively in online courses and 1,833 students live in other State or outside of the United States.
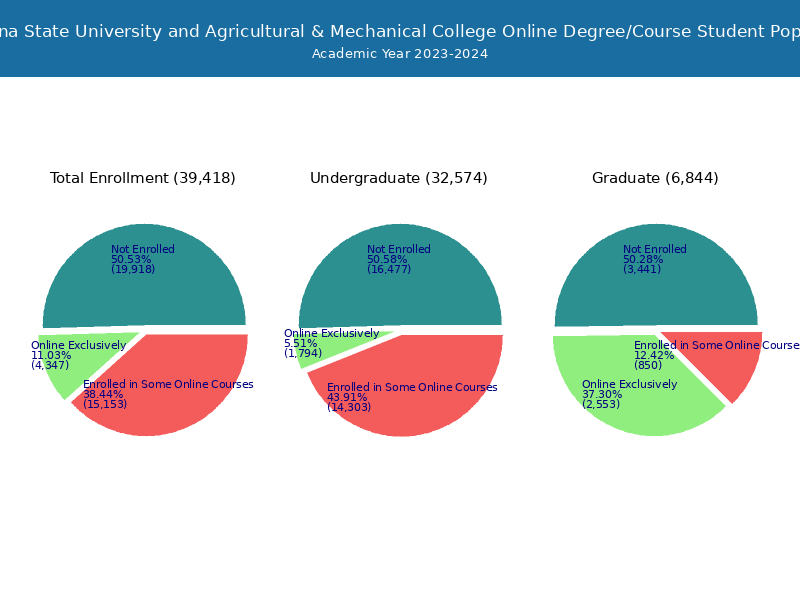
| All Students | Enrolled Exclusively Online Courses | Enrolled in Some Online Courses | |
|---|---|---|---|
| All Students | 37,348 | 3,031 | 15,034 |
| Undergraduate | 30,952 | 1,005 | 14,238 |
| Graduate | 6,396 | 2,026 | 796 |
| Louisiana Residents | Other States in U.S. | Outside of U.S. | |
|---|---|---|---|
| All Students | 1,198 | 1,796 | 37 |
| Undergraduate | 384 | 612 | 9 |
| Graduate | 814 | 1,184 | 28 |
Transfer-in Students (Undergraduate)
Among 30,952 enrolled in undergraduate programs, 998 students have transferred-in from other institutions. The percentage of transfer-in students is 3.22%.871 students have transferred in as full-time status and 127 students transferred in as part-time status.
| Number of Students | |
|---|---|
| Regular Full-time | 25,645 |
| Transfer-in Full-time | 871 |
| Regular Part-time | 4,309 |
| Transfer-in Part-time | 127 |