Student Population by Gender
Indiana University-Bloomington has a total of 47,005 enrolled students for the academic year 2022-2023. 35,660 students have enrolled in undergraduate programs and 11,345 students joined graduate programs.
By gender, 24,008 male and 22,997 female students (the male-female ratio is 51:49) are attending the school. The gender distribution is based on the 2022-2023 data.
| Total | Undergraduate | Graduate | |
|---|---|---|---|
| Total | 47,005 | 35,660 | 11,345 |
| Men | 24,008 | 17,953 | 6,055 |
| Women | 22,997 | 17,707 | 5,290 |
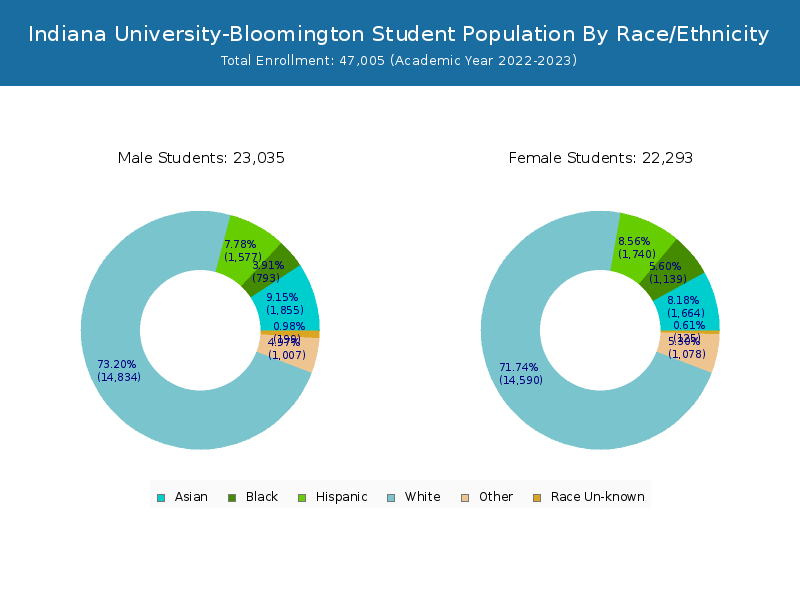
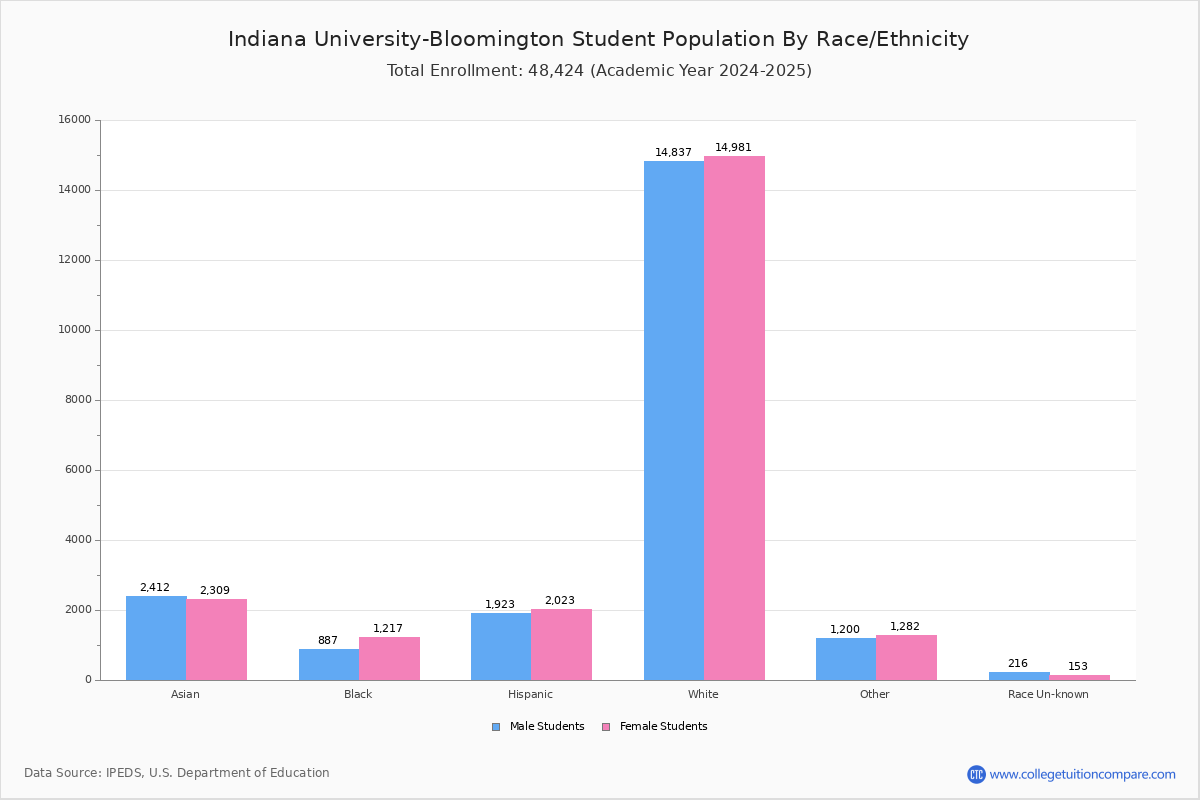
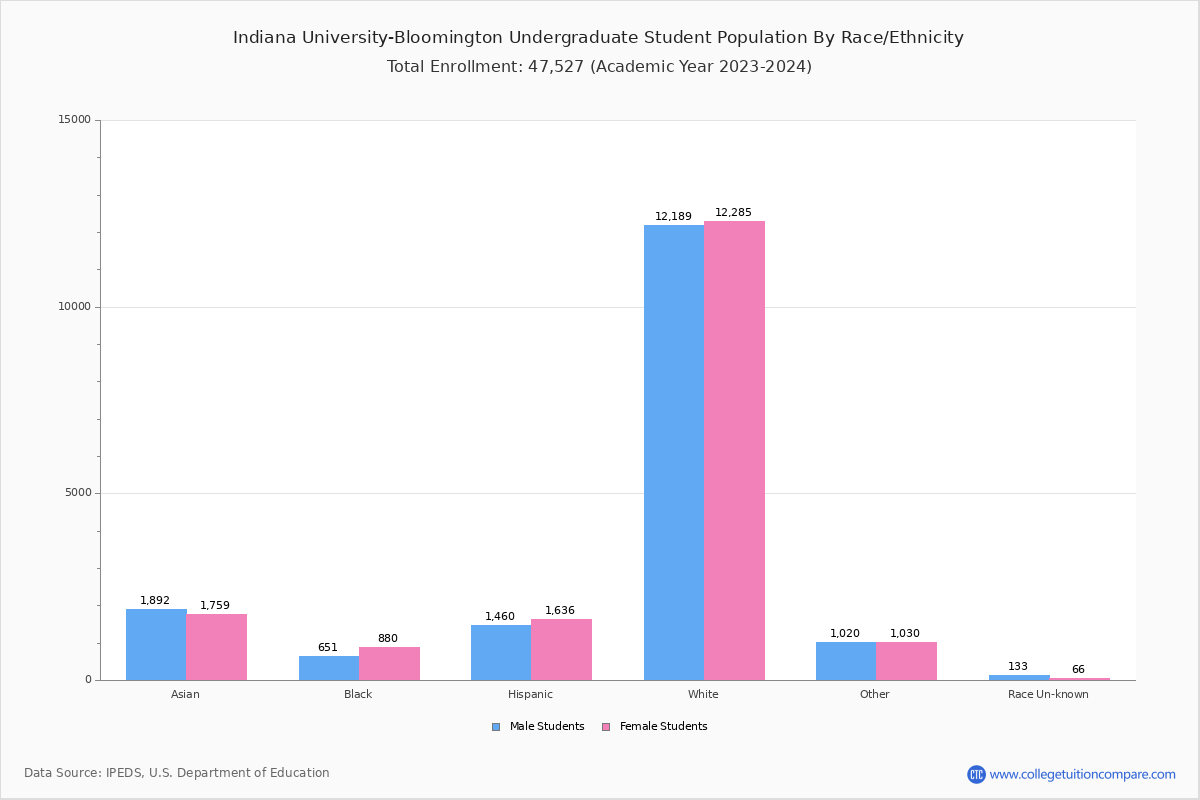
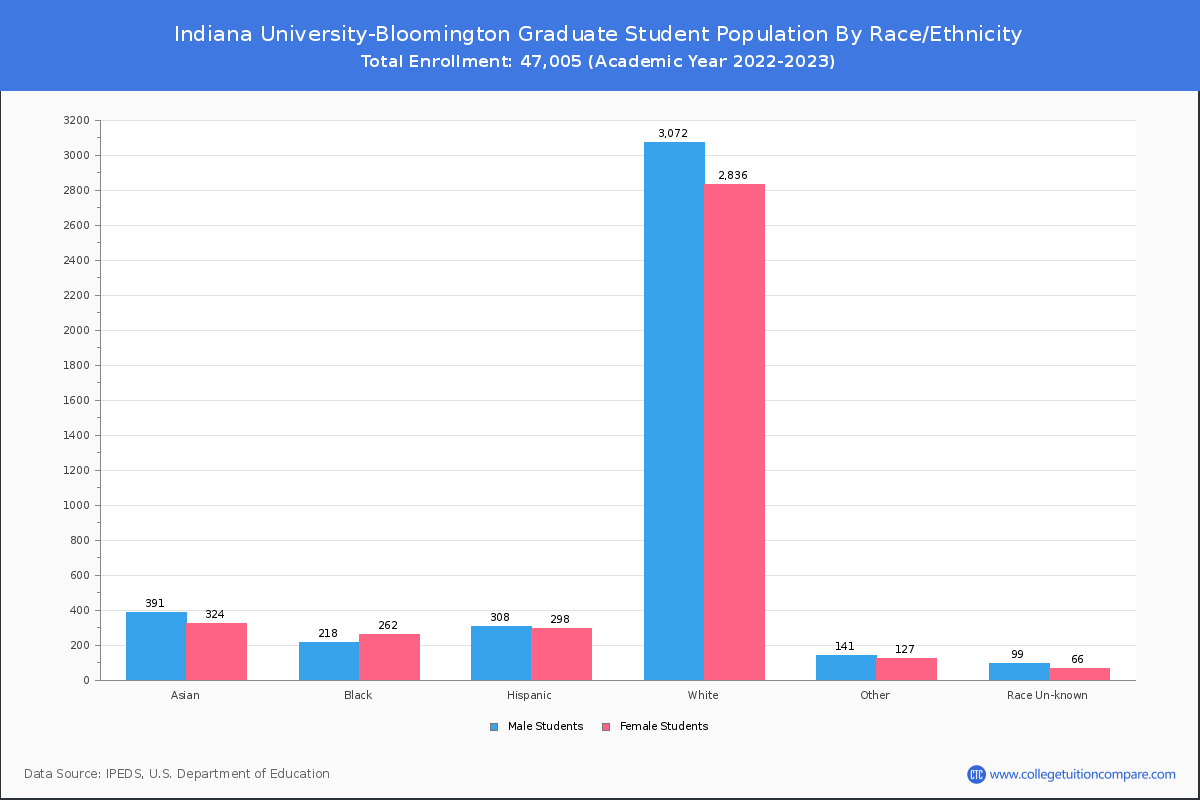
Student Distribution by Race/Ethnicity
By race/ethnicity, 29,611 White, 1,951 Black, and 3,957 Asian students out of a total of 47,005 are attending at Indiana University-Bloomington. Comprehensive enrollment statistic data by race/ethnicity is shown in the next chart (Academic year 2022-2023 data).
| Race | Total | Men | Women |
|---|---|---|---|
| American Indian or Native American | 26 | 14 | 12 |
| Asian | 3,957 | 2,074 | 1,883 |
| Black | 1,951 | 840 | 1,111 |
| Hispanic | 3,560 | 1,719 | 1,841 |
| Native Hawaiian or Other Pacific Islanders | 11 | 7 | 4 |
| White | 29,611 | 14,916 | 14,695 |
| Two or more races | 2,140 | 1,036 | 1,104 |
| Race Unknown | 335 | 205 | 130 |
| Race | Total | Men | Women |
|---|---|---|---|
| American Indian or Native American | 14 | 8 | 6 |
| Asian | 3,250 | 1,697 | 1,553 |
| Black | 1,492 | 638 | 854 |
| Hispanic | 2,923 | 1,383 | 1,540 |
| Native Hawaiian or Other Pacific Islanders | 7 | 4 | 3 |
| White | 24,069 | 12,030 | 12,039 |
| Two or more races | 1,833 | 888 | 945 |
| Race Unknown | 182 | 120 | 62 |
| Race | Total | Men | Women |
|---|---|---|---|
| American Indian or Native American | 1 | 0 | 1 |
| Asian | 25 | 11 | 14 |
| Black | 40 | 22 | 18 |
| Hispanic | 62 | 33 | 29 |
| Native Hawaiian or Other Pacific Islanders | 2 | 1 | 1 |
| White | 440 | 225 | 215 |
| Two or more races | 37 | 26 | 11 |
| Race Unknown | 2 | 2 | 0 |
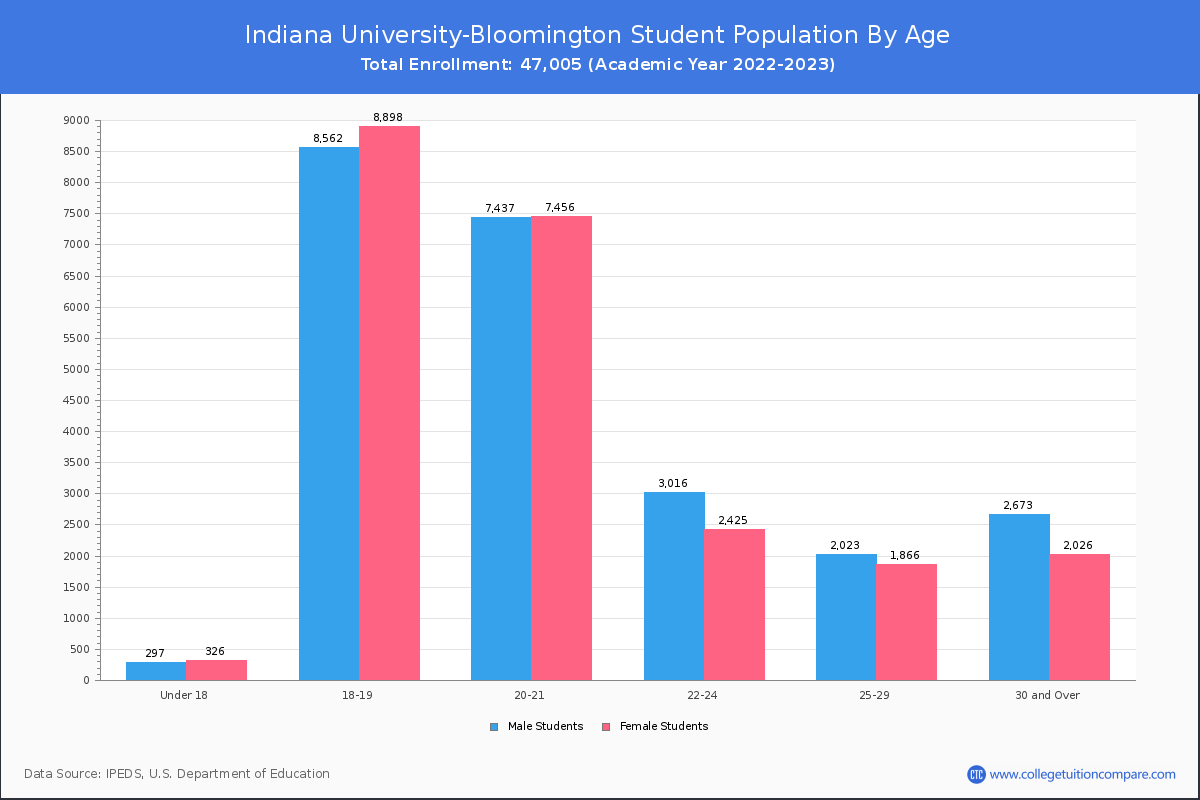
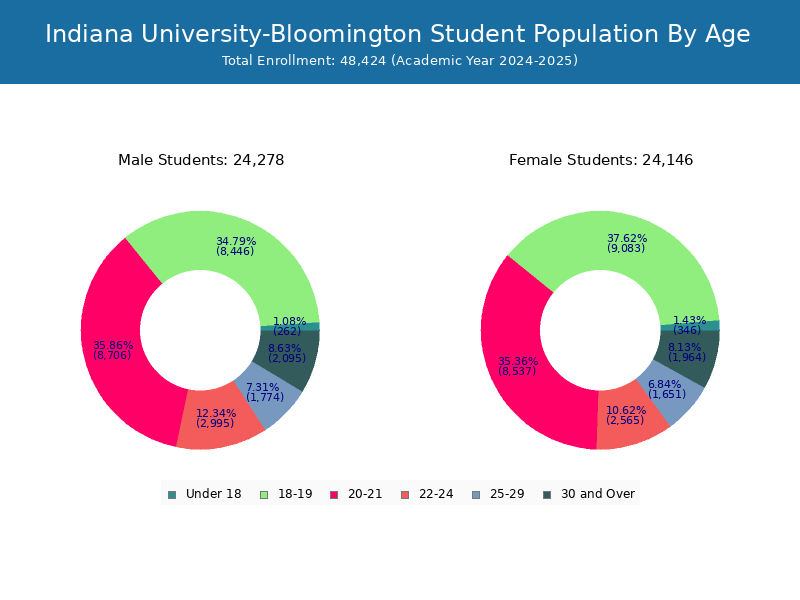
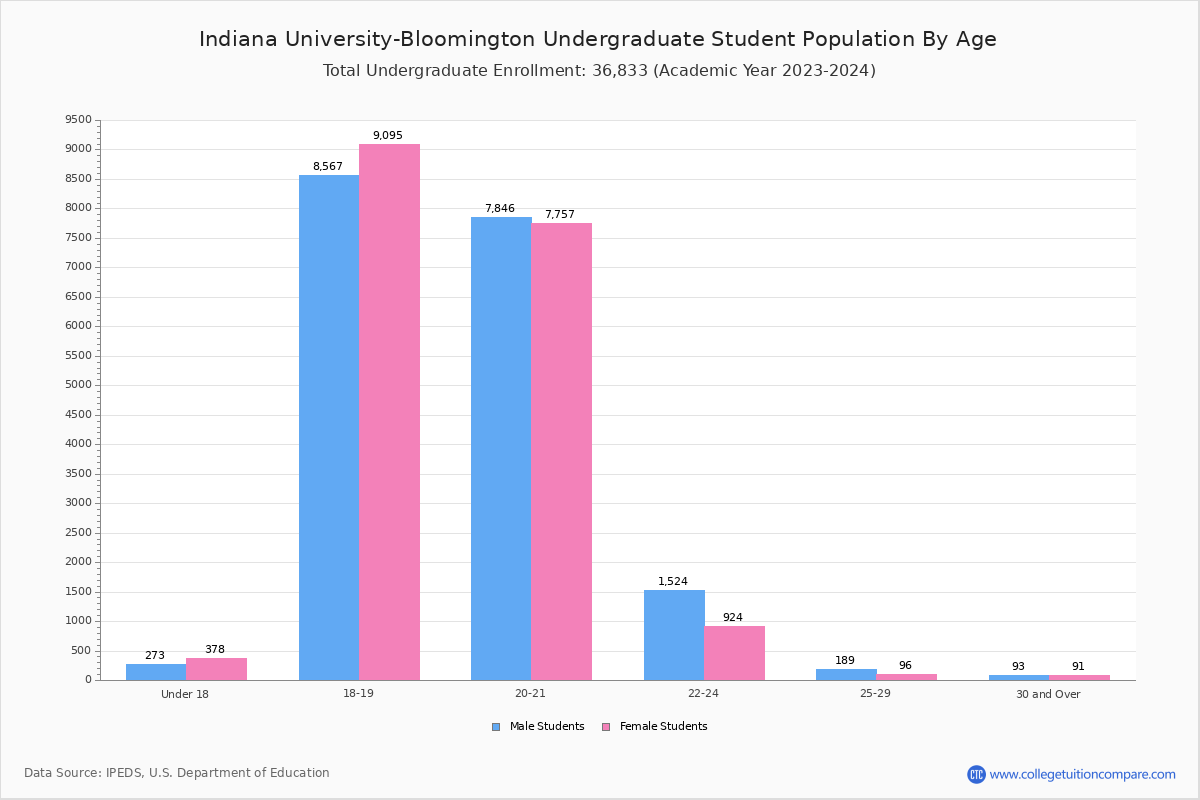
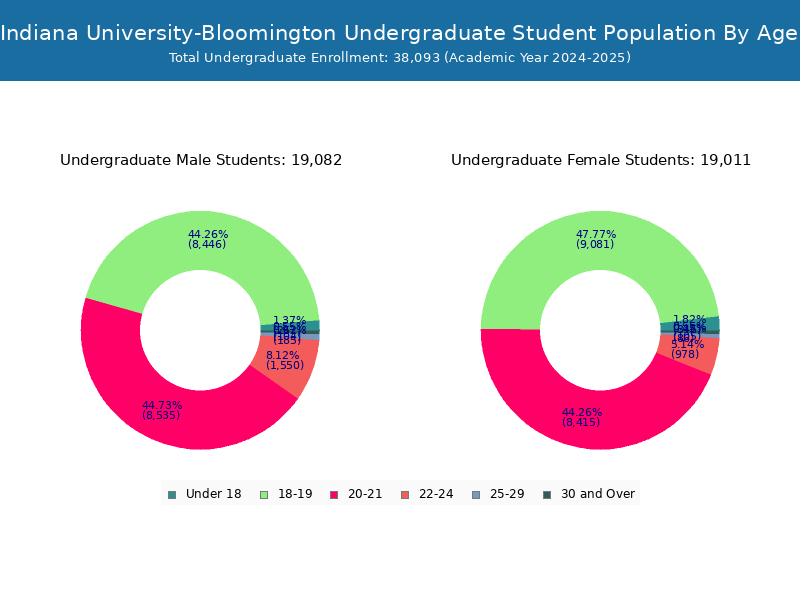
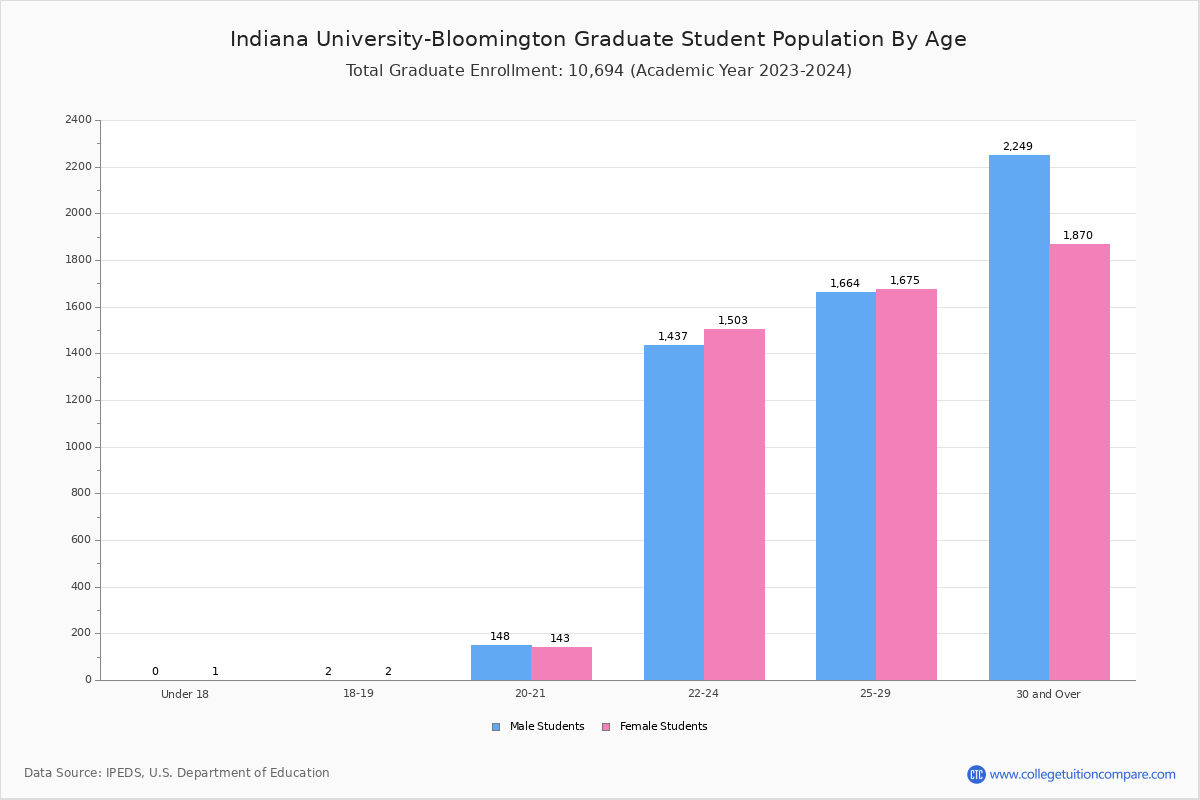
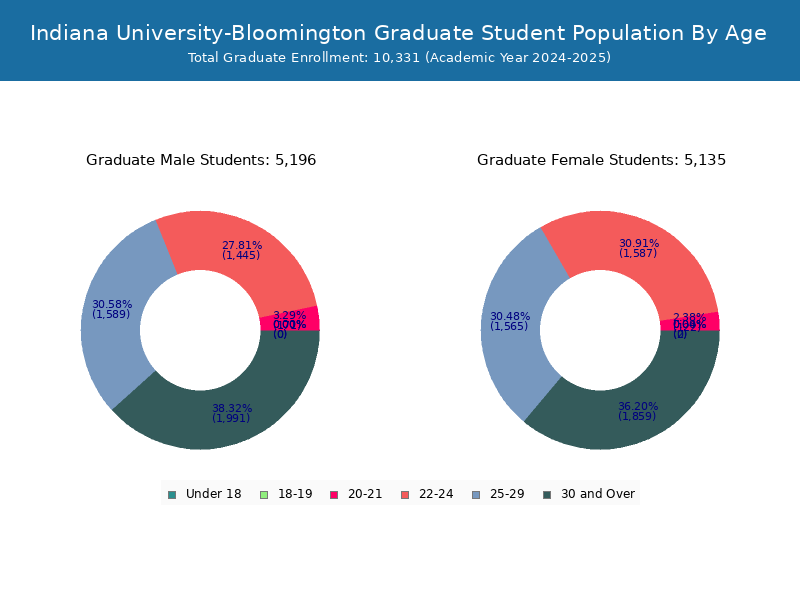
Student Age Distribution
By age, IU has 623 students under 18 years old and 24 students over 65 years old. There are 38,417 students under 25 years old, and 8,588 students over 25 years old out of 47,005 total students.
In undergraduate programs, 622 students are younger than 18 and 6 students are older than 65. IU has 35,152 undergraduate students aged under 25 and 508 students aged 25 and over.
In graduate schools at IU, 1 students are younger than 18 and 18 students are older than 65. It has 3,265 graduate students aged under 25 and 8,080 students aged 25 and over.
| Age | Total | Men | Women |
|---|---|---|---|
| Under 18 | 623 | 326 | 297 |
| 18-19 | 17,460 | 8,898 | 8,562 |
| 20-21 | 14,893 | 7,456 | 7,437 |
| 22-24 | 5,441 | 2,425 | 3,016 |
| 25-29 | 3,889 | 1,866 | 2,023 |
| 30-34 | 2,153 | 865 | 1,288 |
| 35-39 | 1,142 | 496 | 646 |
| 40-49 | 1,093 | 500 | 593 |
| 50-64 | 287 | 152 | 135 |
| Over 65 | 24 | 13 | 11 |
| Age | Total | Men | Women |
|---|---|---|---|
| Under 18 | 622 | 325 | 297 |
| 18-19 | 17,457 | 8,898 | 8,559 |
| 20-21 | 14,602 | 7,315 | 7,287 |
| 22-24 | 2,471 | 939 | 1,532 |
| 25-29 | 313 | 124 | 189 |
| 30-34 | 100 | 46 | 54 |
| 35-39 | 25 | 16 | 9 |
| 40-49 | 36 | 25 | 11 |
| 50-64 | 28 | 15 | 13 |
| Over 65 | 6 | 4 | 2 |
| Age | Total | Men | Women |
|---|---|---|---|
| Under 18 | 1 | 1 | 0 |
| 18-19 | 3 | 0 | 3 |
| 20-21 | 291 | 141 | 150 |
| 22-24 | 2,970 | 1,486 | 1,484 |
| 25-29 | 3,576 | 1,742 | 1,834 |
| 30-34 | 2,053 | 819 | 1,234 |
| 35-39 | 1,117 | 480 | 637 |
| 40-49 | 1,057 | 475 | 582 |
| 50-64 | 259 | 137 | 122 |
| Over 65 | 18 | 9 | 9 |
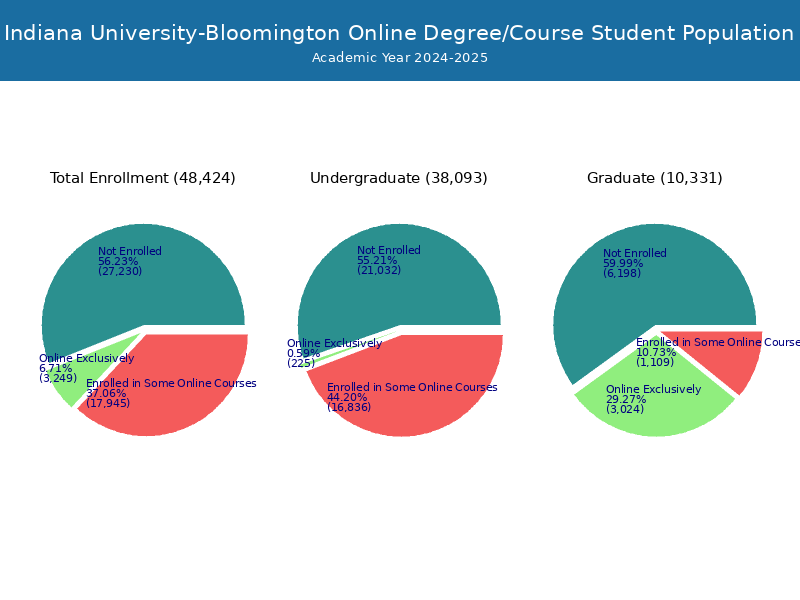
Online Student Enrollment
Distance learning, also called online education, is very attractive to students, especially who want to continue education and work in field. At Indiana University-Bloomington, 3,617 students are enrolled exclusively in online courses and 16,361 students are enrolled in some online courses.
1,060 students lived in Indiana or jurisdiction in which the school is located are enrolled exclusively in online courses and 2,557 students live in other State or outside of the United States.
| All Students | Enrolled Exclusively Online Courses | Enrolled in Some Online Courses | |
|---|---|---|---|
| All Students | 47,005 | 3,617 | 16,361 |
| Undergraduate | 35,660 | 159 | 14,820 |
| Graduate | 11,345 | 3,458 | 1,541 |
| Indiana Residents | Other States in U.S. | Outside of U.S. | |
|---|---|---|---|
| All Students | 1,060 | 2,275 | 282 |
| Undergraduate | 126 | 32 | 1 |
| Graduate | 934 | 2,243 | 281 |
Transfer-in Students (Undergraduate)
Among 35,660 enrolled in undergraduate programs, 653 students have transferred-in from other institutions. The percentage of transfer-in students is 1.83%.638 students have transferred in as full-time status and 15 students transferred in as part-time status.
| Number of Students | |
|---|---|
| Regular Full-time | 34,027 |
| Transfer-in Full-time | 638 |
| Regular Part-time | 980 |
| Transfer-in Part-time | 15 |