Student Population by Gender
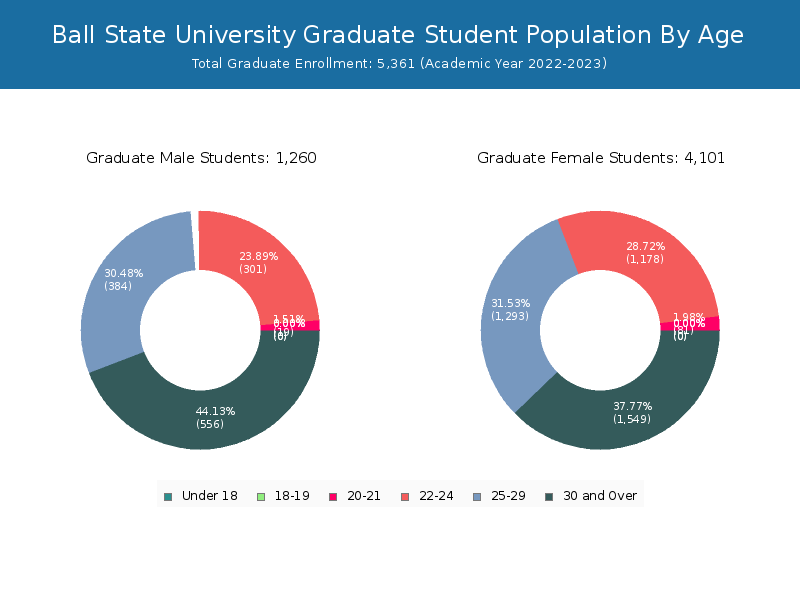
Ball State University has a total of 19,777 enrolled students for the academic year 2022-2023. 14,416 students have enrolled in undergraduate programs and 5,361 students joined graduate programs.
By gender, 6,882 male and 12,895 female students (the male-female ratio is 35:65) are attending the school. The gender distribution is based on the 2022-2023 data.
| Total | Undergraduate | Graduate | |
|---|---|---|---|
| Total | 19,777 | 14,416 | 5,361 |
| Men | 6,882 | 5,622 | 1,260 |
| Women | 12,895 | 8,794 | 4,101 |
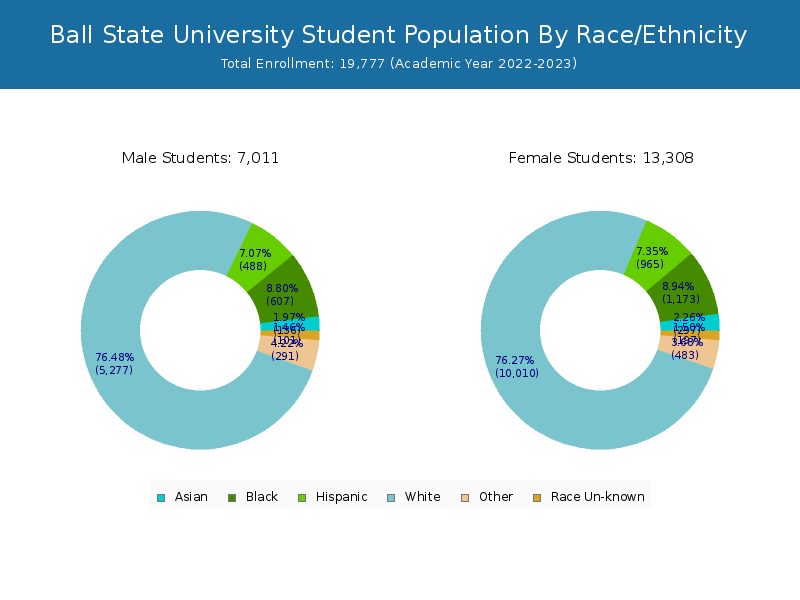
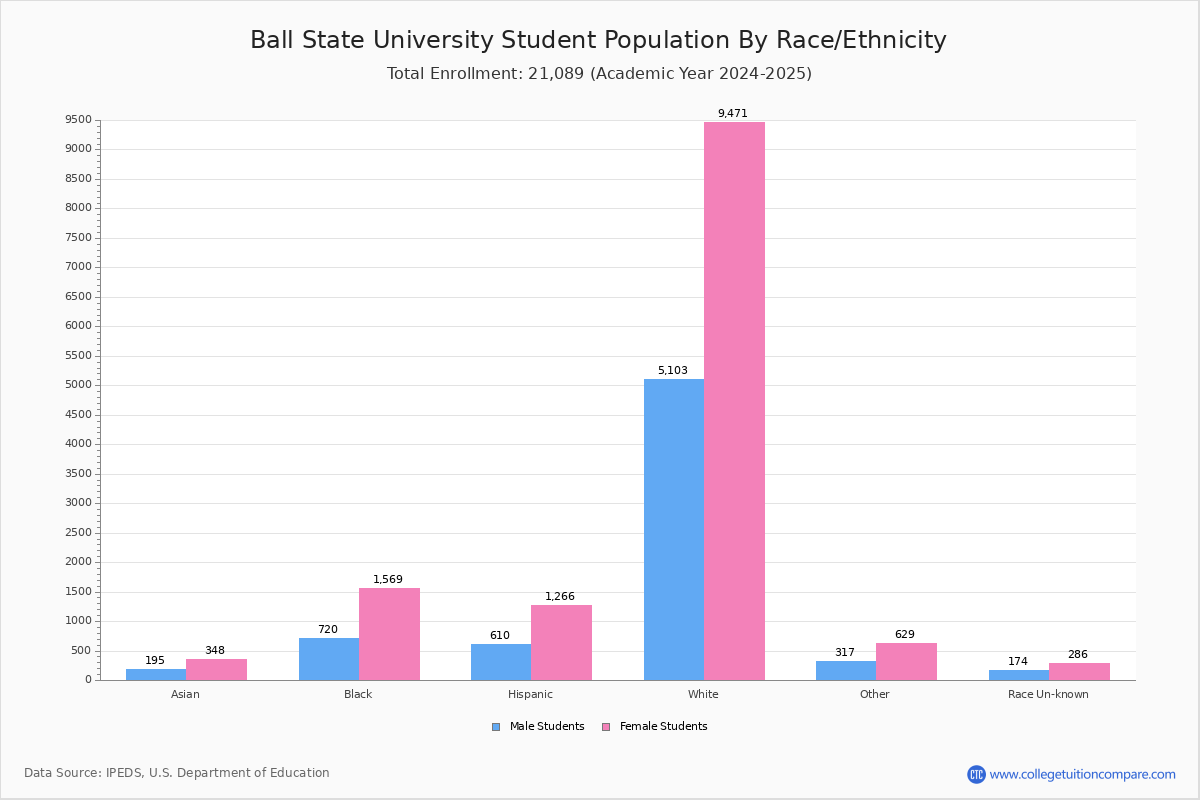
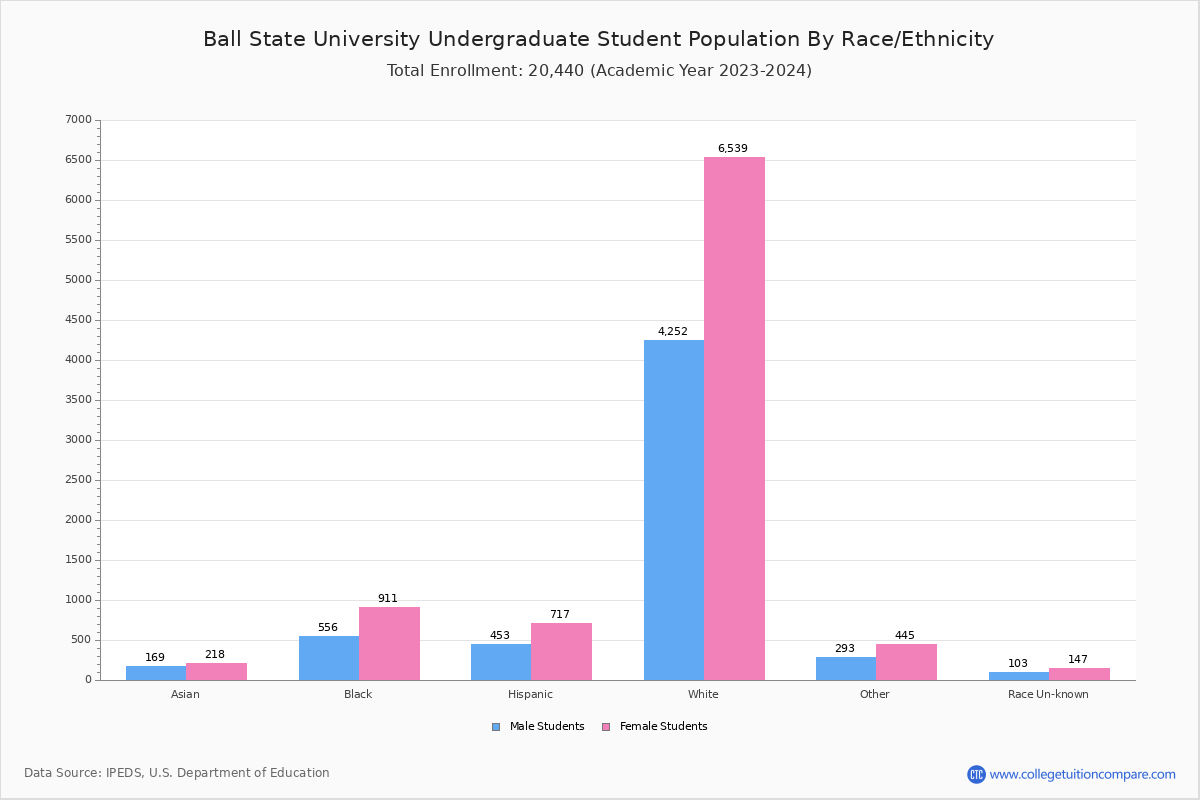
Student Distribution by Race/Ethnicity
By race/ethnicity, 14,557 White, 1,785 Black, and 439 Asian students out of a total of 19,777 are attending at Ball State University. Comprehensive enrollment statistic data by race/ethnicity is shown in the next chart (Academic year 2022-2023 data).

| Race | Total | Men | Women |
|---|---|---|---|
| American Indian or Native American | 24 | 7 | 17 |
| Asian | 439 | 162 | 277 |
| Black | 1,785 | 588 | 1,197 |
| Hispanic | 1,510 | 518 | 992 |
| Native Hawaiian or Other Pacific Islanders | 14 | 8 | 6 |
| White | 14,557 | 5,057 | 9,500 |
| Two or more races | 770 | 279 | 491 |
| Race Unknown | 341 | 118 | 223 |
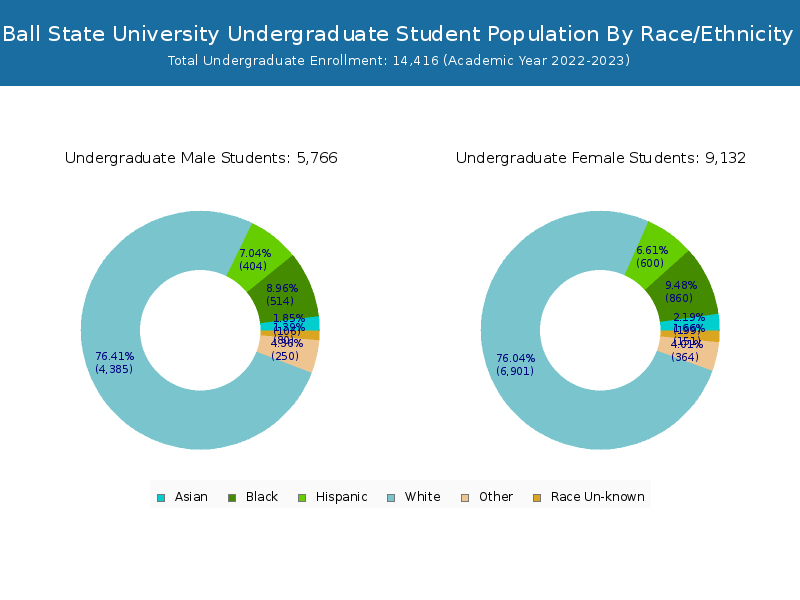
| Race | Total | Men | Women |
|---|---|---|---|
| American Indian or Native American | 21 | 6 | 15 |
| Asian | 319 | 123 | 196 |
| Black | 1,336 | 501 | 835 |
| Hispanic | 1,050 | 425 | 625 |
| Native Hawaiian or Other Pacific Islanders | 11 | 6 | 5 |
| White | 10,723 | 4,187 | 6,536 |
| Two or more races | 618 | 241 | 377 |
| Race Unknown | 254 | 100 | 154 |
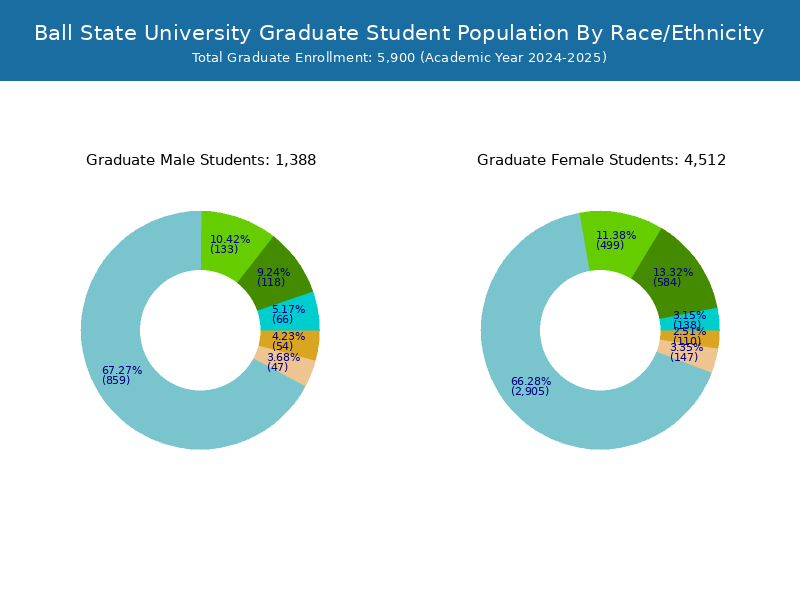
| Race | Total | Men | Women |
|---|---|---|---|
| American Indian or Native American | 0 | 0 | 0 |
| Asian | 7 | 2 | 5 |
| Black | 52 | 19 | 33 |
| Hispanic | 46 | 14 | 32 |
| Native Hawaiian or Other Pacific Islanders | 0 | 0 | 0 |
| White | 372 | 152 | 220 |
| Two or more races | 26 | 13 | 13 |
| Race Unknown | 5 | 4 | 1 |
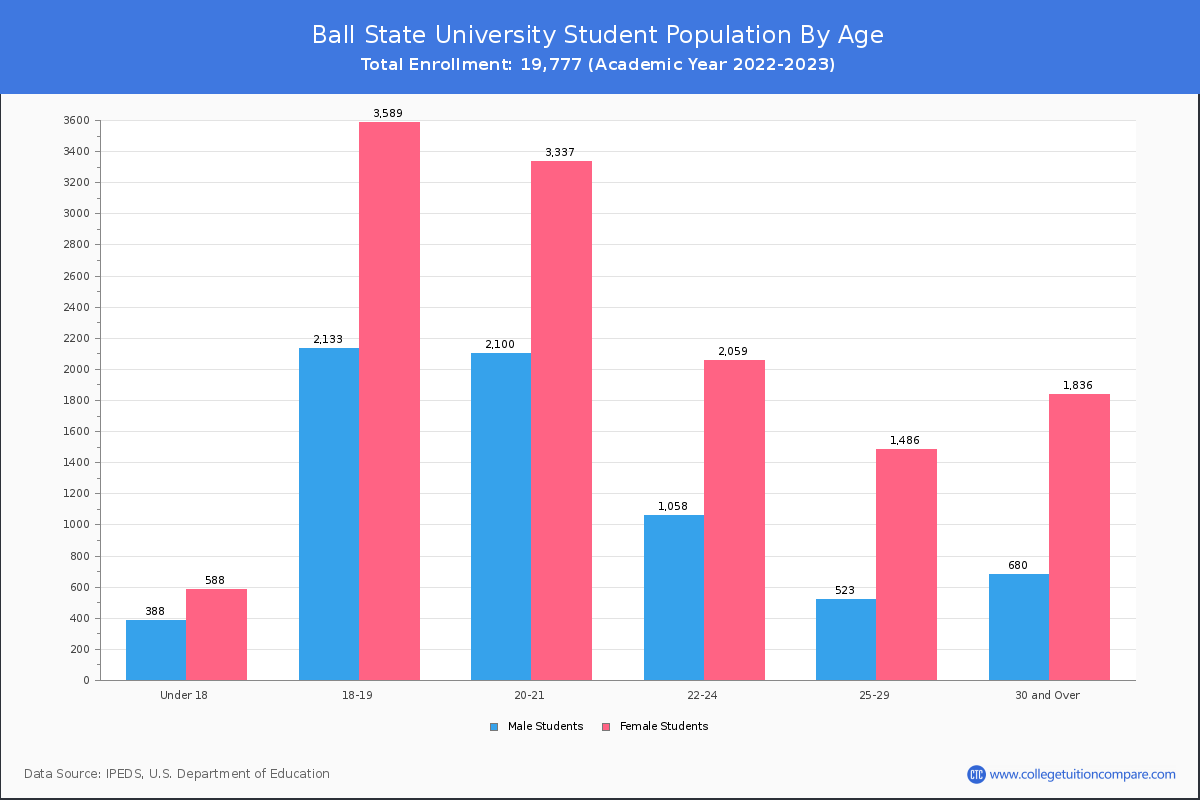
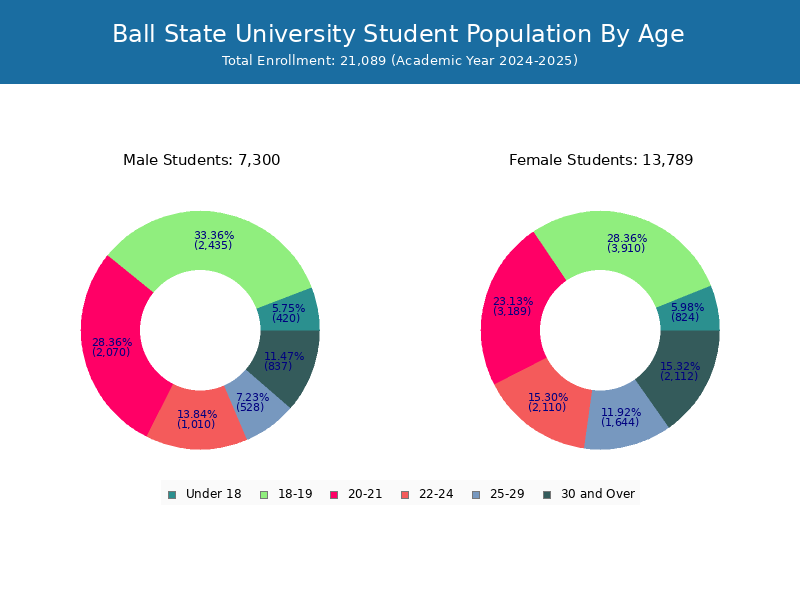
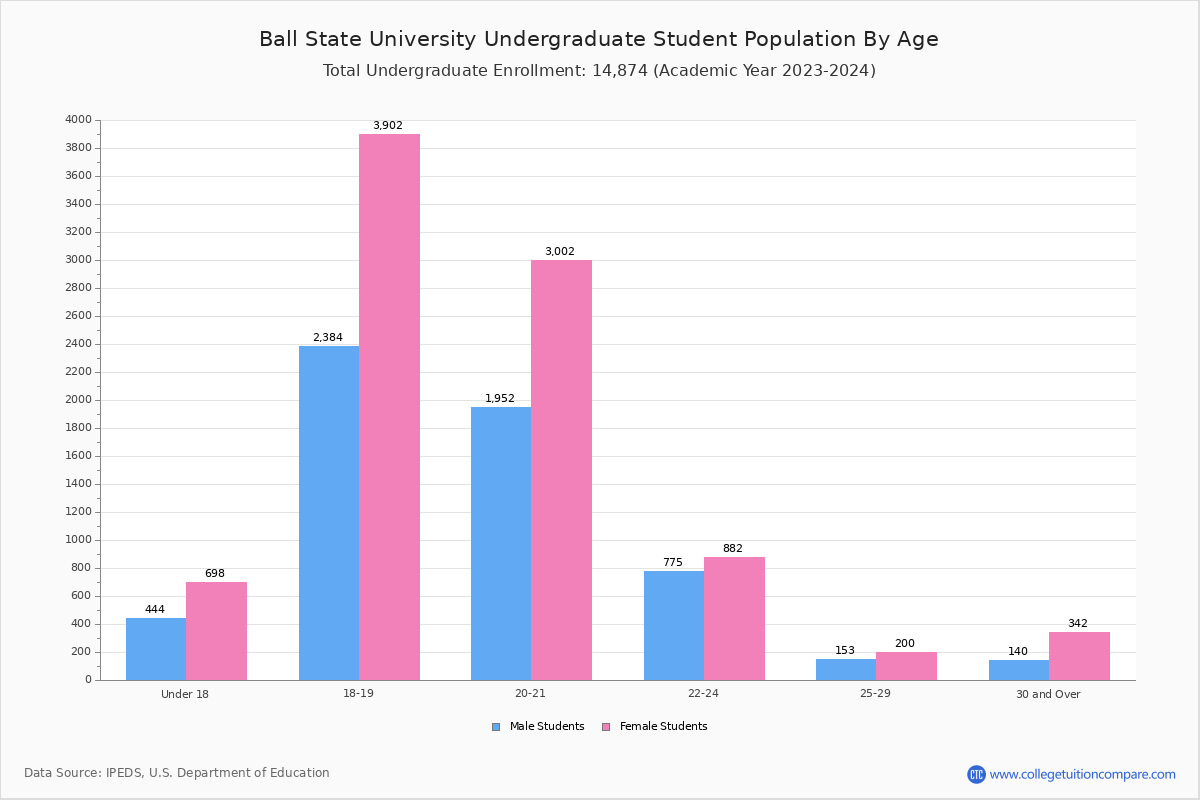
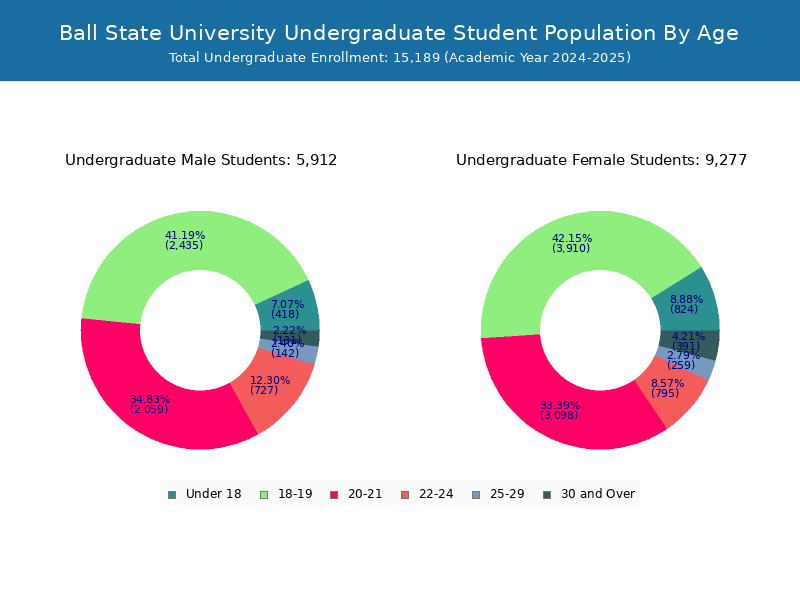
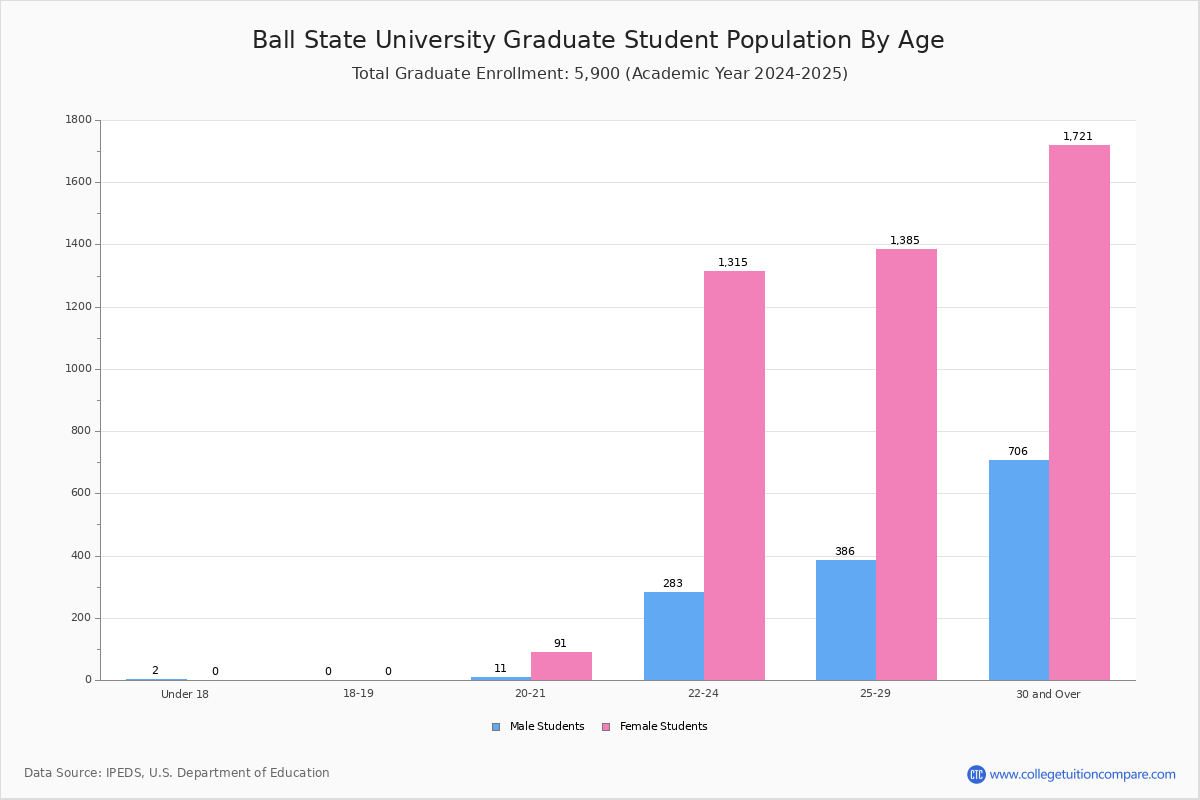
Student Age Distribution
By age, BSU has 976 students under 18 years old and 16 students over 65 years old. There are 15,252 students under 25 years old, and 4,525 students over 25 years old out of 19,777 total students.
In undergraduate programs, 976 students are younger than 18 and 2 students are older than 65. BSU has 13,673 undergraduate students aged under 25 and 743 students aged 25 and over.
It has 1,579 graduate students aged under 25 and 3,782 students aged 25 and over.
| Age | Total | Men | Women |
|---|---|---|---|
| Under 18 | 976 | 588 | 388 |
| 18-19 | 5,722 | 3,589 | 2,133 |
| 20-21 | 5,437 | 3,337 | 2,100 |
| 22-24 | 3,117 | 2,059 | 1,058 |
| 25-29 | 2,009 | 1,486 | 523 |
| 30-34 | 933 | 663 | 270 |
| 35-39 | 612 | 422 | 190 |
| 40-49 | 684 | 534 | 150 |
| 50-64 | 271 | 206 | 65 |
| Over 65 | 16 | 11 | 5 |
| Age | Total | Men | Women |
|---|---|---|---|
| Under 18 | 976 | 588 | 388 |
| 18-19 | 5,722 | 3,589 | 2,133 |
| 20-21 | 5,337 | 3,256 | 2,081 |
| 22-24 | 1,638 | 881 | 757 |
| 25-29 | 332 | 193 | 139 |
| 30-34 | 172 | 112 | 60 |
| 35-39 | 103 | 75 | 28 |
| 40-49 | 87 | 62 | 25 |
| 50-64 | 47 | 38 | 9 |
| Over 65 | 2 | 0 | 2 |
| Age | Total | Men | Women |
|---|
Online Student Enrollment
Distance learning, also called online education, is very attractive to students, especially who want to continue education and work in field. At Ball State University, 5,040 students are enrolled exclusively in online courses and 6,716 students are enrolled in some online courses.
2,591 students lived in Indiana or jurisdiction in which the school is located are enrolled exclusively in online courses and 2,449 students live in other State or outside of the United States.
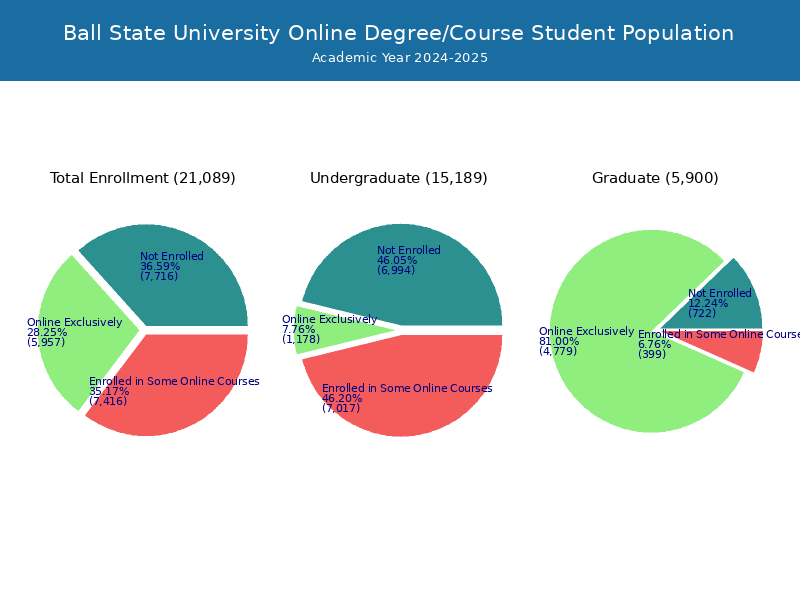
| All Students | Enrolled Exclusively Online Courses | Enrolled in Some Online Courses | |
|---|---|---|---|
| All Students | 19,777 | 5,040 | 6,716 |
| Undergraduate | 14,416 | 953 | 6,226 |
| Graduate | 5,361 | 4,087 | 490 |
| Indiana Residents | Other States in U.S. | Outside of U.S. | |
|---|---|---|---|
| All Students | 2,591 | 2,424 | 25 |
| Undergraduate | 807 | 144 | 2 |
| Graduate | 1,784 | 2,280 | 23 |
Transfer-in Students (Undergraduate)
Among 14,416 enrolled in undergraduate programs, 522 students have transferred-in from other institutions. The percentage of transfer-in students is 3.62%.459 students have transferred in as full-time status and 63 students transferred in as part-time status.
| Number of Students | |
|---|---|
| Regular Full-time | 12,163 |
| Transfer-in Full-time | 459 |
| Regular Part-time | 1,731 |
| Transfer-in Part-time | 63 |