Student Population by Gender
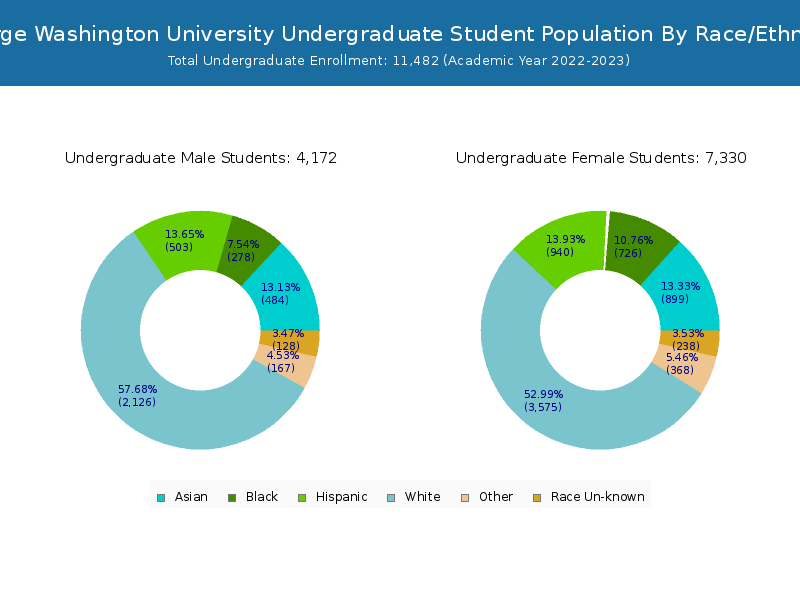
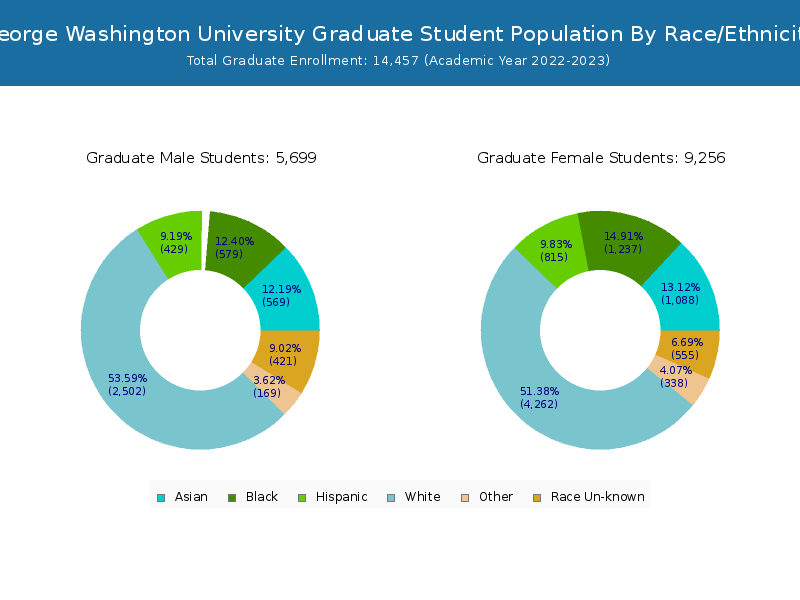
George Washington University has a total of 25,939 enrolled students for the academic year 2022-2023. 11,482 students have enrolled in undergraduate programs and 14,457 students joined graduate programs.
By gender, 9,774 male and 16,165 female students (the male-female ratio is 38:62) are attending the school. The gender distribution is based on the 2022-2023 data.
| Total | Undergraduate | Graduate | |
|---|---|---|---|
| Total | 25,939 | 11,482 | 14,457 |
| Men | 9,774 | 4,176 | 5,598 |
| Women | 16,165 | 7,306 | 8,859 |
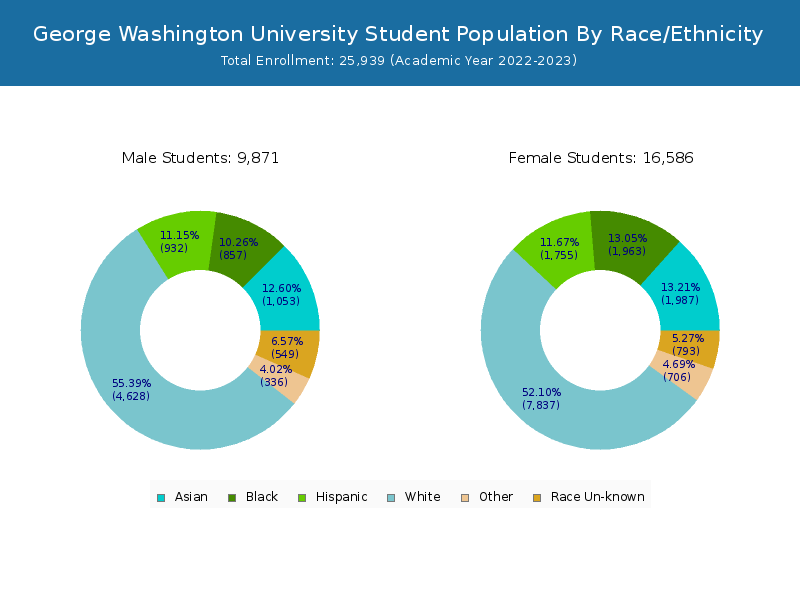
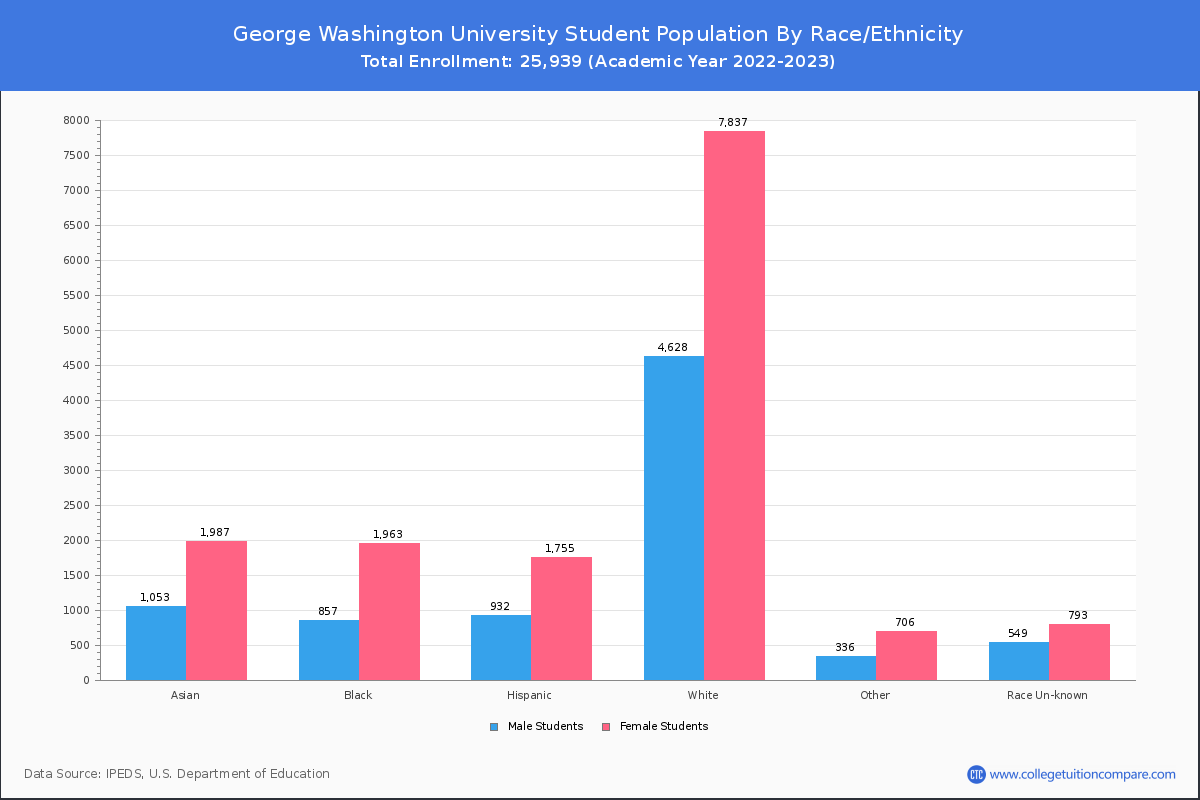
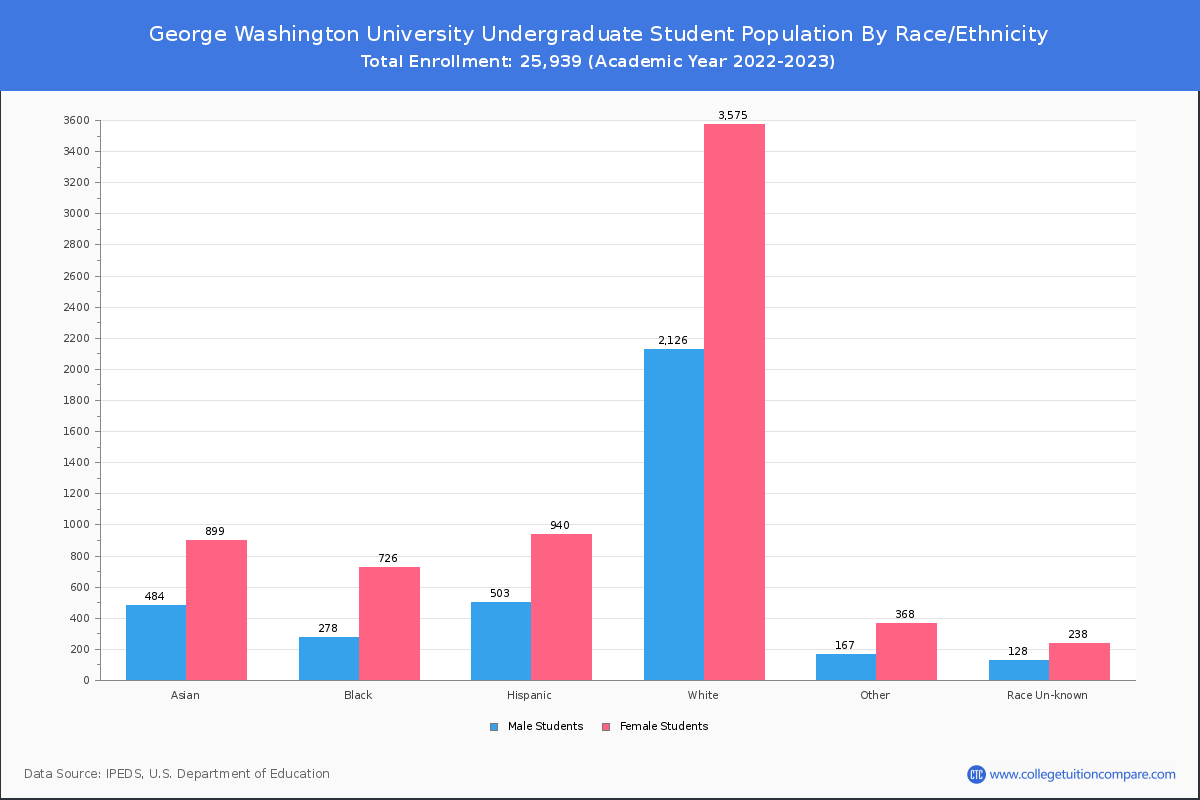
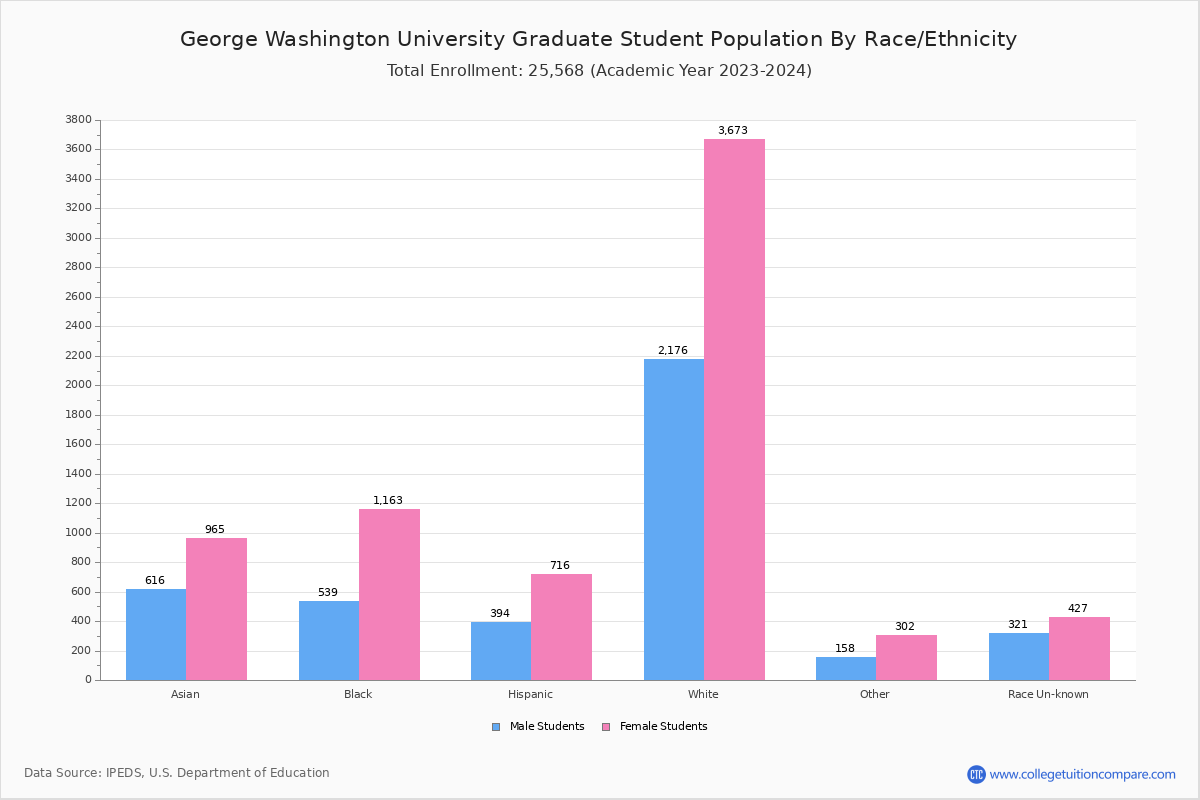
Student Distribution by Race/Ethnicity
By race/ethnicity, 11,888 White, 2,608 Black, and 3,195 Asian students out of a total of 25,939 are attending at George Washington University. Comprehensive enrollment statistic data by race/ethnicity is shown in the next chart (Academic year 2022-2023 data).
| Race | Total | Men | Women |
|---|---|---|---|
| American Indian or Native American | 39 | 19 | 20 |
| Asian | 3,195 | 1,162 | 2,033 |
| Black | 2,608 | 779 | 1,829 |
| Hispanic | 2,640 | 916 | 1,724 |
| Native Hawaiian or Other Pacific Islanders | 32 | 10 | 22 |
| White | 11,888 | 4,398 | 7,490 |
| Two or more races | 1,017 | 327 | 690 |
| Race Unknown | 1,178 | 471 | 707 |
| Race | Total | Men | Women |
|---|---|---|---|
| American Indian or Native American | 8 | 4 | 4 |
| Asian | 1,531 | 547 | 984 |
| Black | 937 | 262 | 675 |
| Hispanic | 1,488 | 521 | 967 |
| Native Hawaiian or Other Pacific Islanders | 12 | 3 | 9 |
| White | 5,574 | 2,055 | 3,519 |
| Two or more races | 579 | 193 | 386 |
| Race Unknown | 321 | 102 | 219 |
| Race | Total | Men | Women |
|---|---|---|---|
| American Indian or Native American | 1 | 0 | 1 |
| Asian | 51 | 13 | 38 |
| Black | 57 | 23 | 34 |
| Hispanic | 52 | 20 | 32 |
| Native Hawaiian or Other Pacific Islanders | 1 | 0 | 1 |
| White | 164 | 53 | 111 |
| Two or more races | 13 | 6 | 7 |
| Race Unknown | 10 | 5 | 5 |
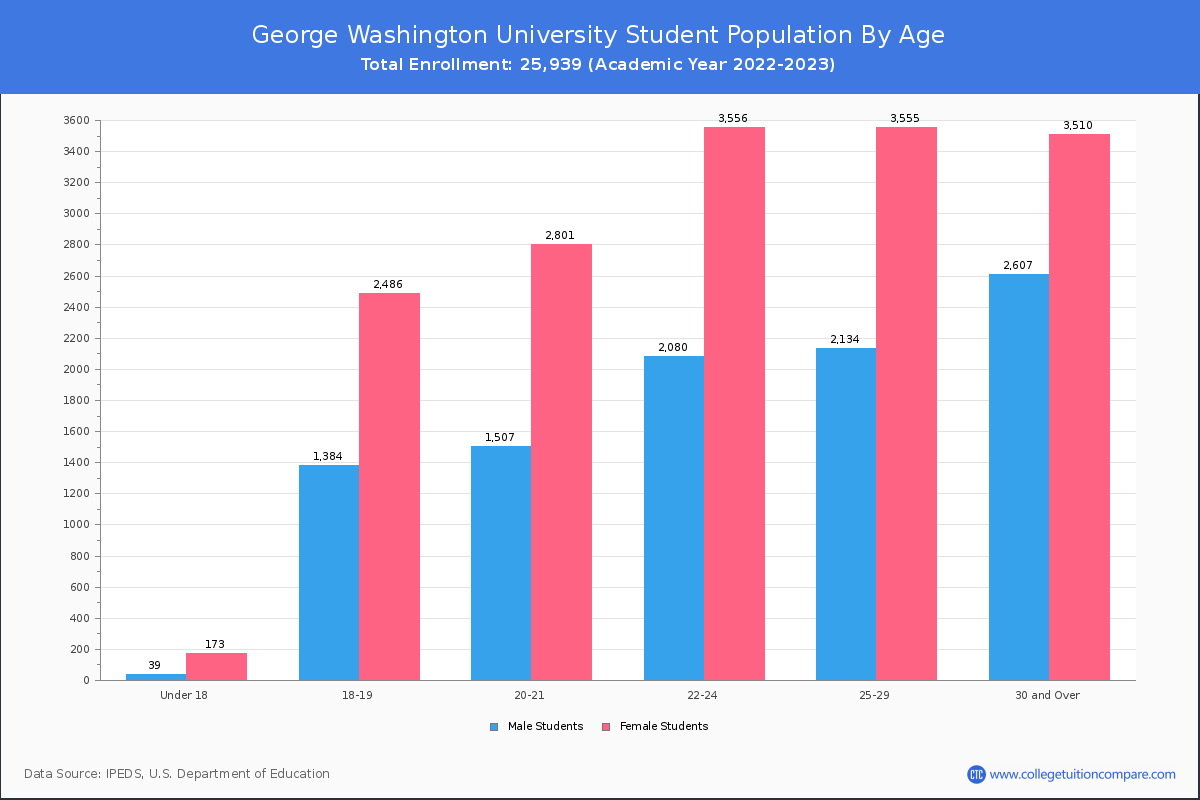
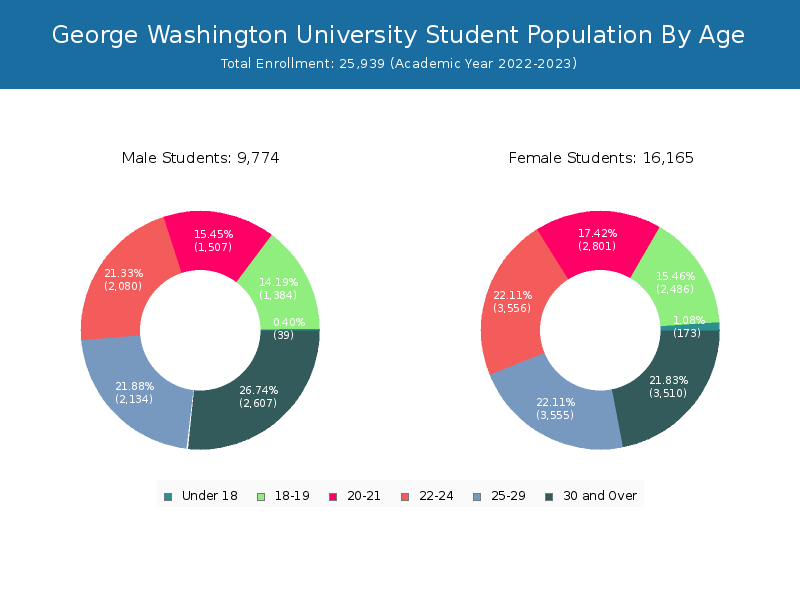
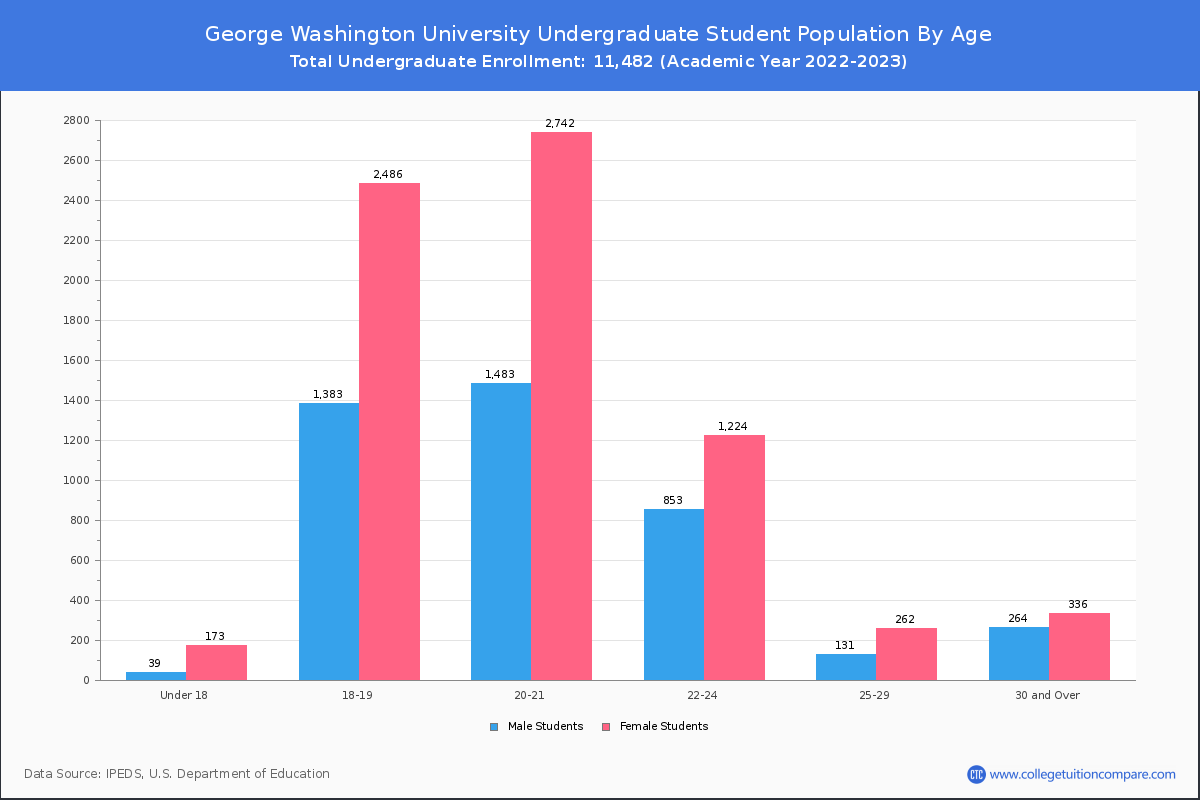
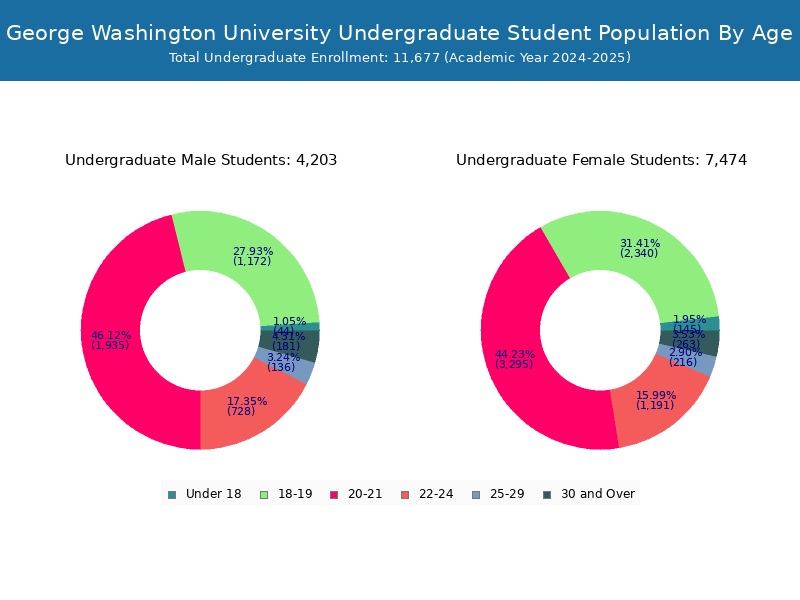
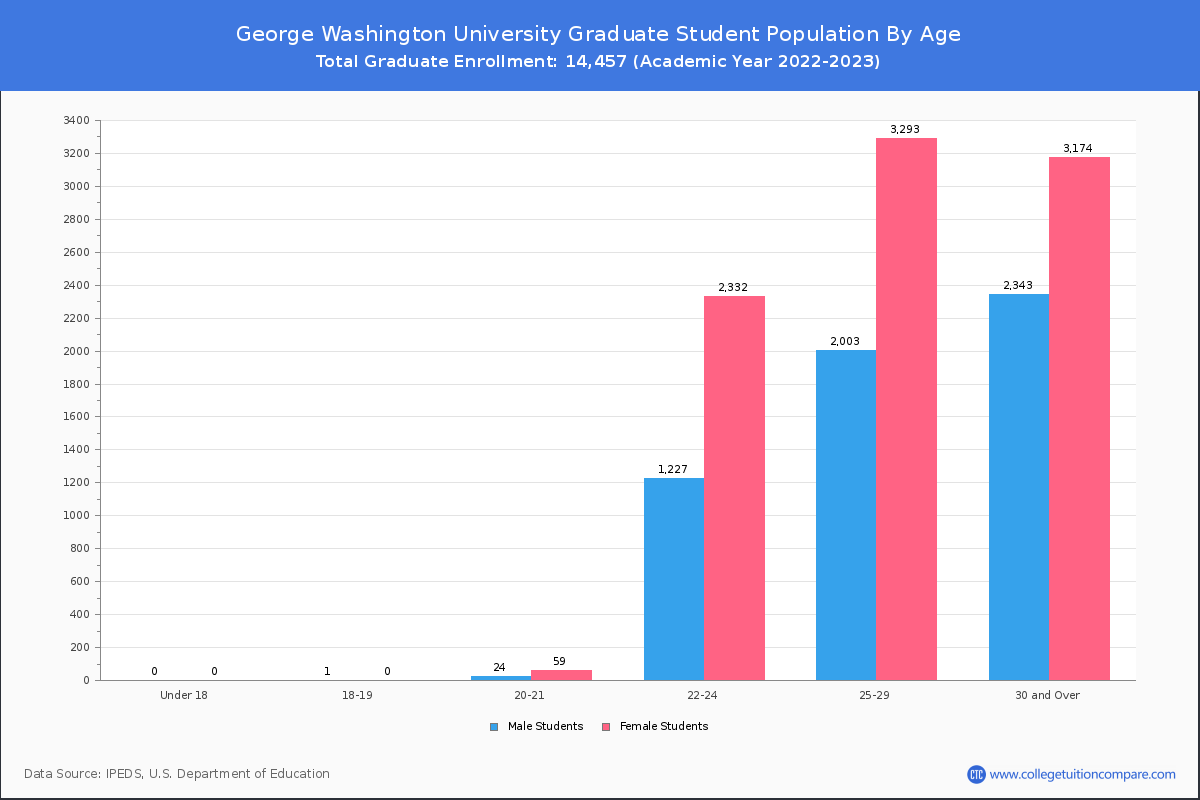
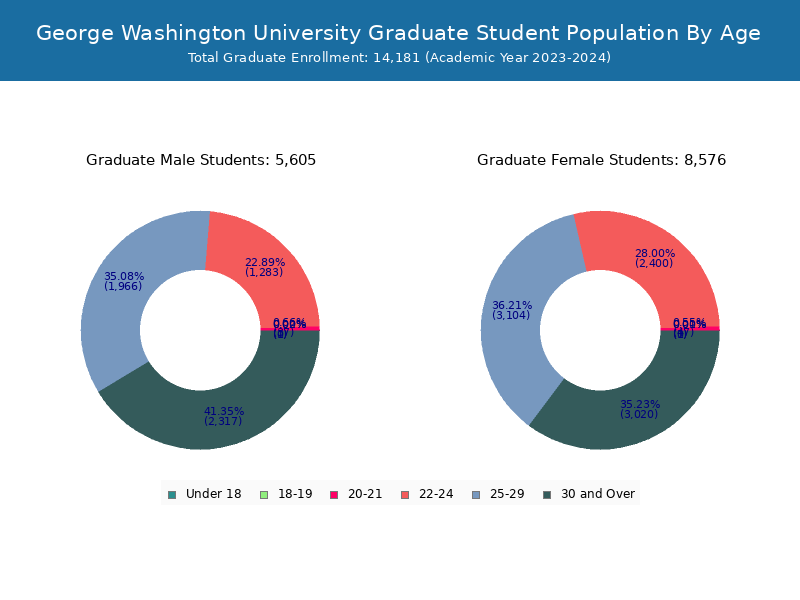
Student Age Distribution
By age, GWU has 212 students under 18 years old and 42 students over 65 years old. There are 14,026 students under 25 years old, and 11,806 students over 25 years old out of 25,939 total students.
In undergraduate programs, 212 students are younger than 18 and 3 students are older than 65. GWU has 10,383 undergraduate students aged under 25 and 993 students aged 25 and over.
It has 3,643 graduate students aged under 25 and 10,813 students aged 25 and over.
| Age | Total | Men | Women |
|---|---|---|---|
| Under 18 | 212 | 173 | 39 |
| 18-19 | 3,870 | 2,486 | 1,384 |
| 20-21 | 4,308 | 2,801 | 1,507 |
| 22-24 | 5,636 | 3,556 | 2,080 |
| 25-29 | 5,689 | 3,555 | 2,134 |
| 30-34 | 2,485 | 1,392 | 1,093 |
| 35-39 | 1,379 | 787 | 592 |
| 40-49 | 1,552 | 903 | 649 |
| 50-64 | 659 | 408 | 251 |
| Over 65 | 42 | 20 | 22 |
| Age | Total | Men | Women |
|---|---|---|---|
| Under 18 | 212 | 173 | 39 |
| 18-19 | 3,869 | 2,486 | 1,383 |
| 20-21 | 4,225 | 2,742 | 1,483 |
| 22-24 | 2,077 | 1,224 | 853 |
| 25-29 | 393 | 262 | 131 |
| 30-34 | 231 | 109 | 122 |
| 35-39 | 160 | 82 | 78 |
| 40-49 | 140 | 98 | 42 |
| 50-64 | 66 | 45 | 21 |
| Over 65 | 3 | 2 | 1 |
| Age | Total | Men | Women |
|---|
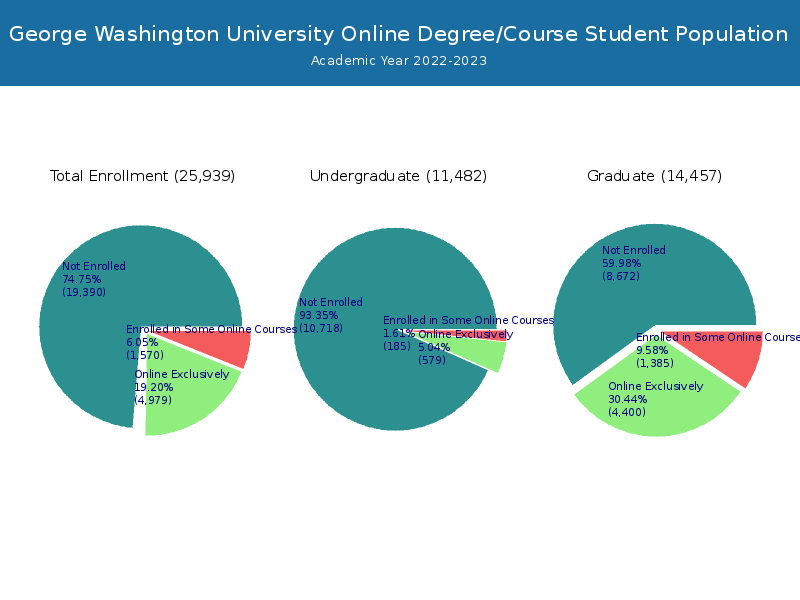
Online Student Enrollment
Distance learning, also called online education, is very attractive to students, especially who want to continue education and work in field. At George Washington University, 4,979 students are enrolled exclusively in online courses and 1,570 students are enrolled in some online courses.
275 students lived in District of Columbia or jurisdiction in which the school is located are enrolled exclusively in online courses and 4,704 students live in other State or outside of the United States.
| All Students | Enrolled Exclusively Online Courses | Enrolled in Some Online Courses | |
|---|---|---|---|
| All Students | 25,939 | 4,979 | 1,570 |
| Undergraduate | 11,482 | 579 | 185 |
| Graduate | 14,457 | 4,400 | 1,385 |
| District of Columbia Residents | Other States in U.S. | Outside of U.S. | |
|---|---|---|---|
| All Students | 275 | 4,682 | 22 |
| Undergraduate | 18 | 558 | 3 |
| Graduate | 257 | 4,124 | 19 |
Transfer-in Students (Undergraduate)
Among 11,482 enrolled in undergraduate programs, 357 students have transferred-in from other institutions. The percentage of transfer-in students is 3.11%.252 students have transferred in as full-time status and 105 students transferred in as part-time status.
| Number of Students | |
|---|---|
| Regular Full-time | 10,080 |
| Transfer-in Full-time | 252 |
| Regular Part-time | 1,045 |
| Transfer-in Part-time | 105 |