Student Population by Gender
National University has a total of 18,631 enrolled students for the academic year 2022-2023. 8,485 students have enrolled in undergraduate programs and 10,146 students joined graduate programs.
By gender, 6,865 male and 11,766 female students (the male-female ratio is 37:63) are attending the school. The gender distribution is based on the 2022-2023 data.
| Total | Undergraduate | Graduate | |
|---|---|---|---|
| Total | 18,631 | 8,485 | 10,146 |
| Men | 6,865 | 3,956 | 2,909 |
| Women | 11,766 | 4,529 | 7,237 |
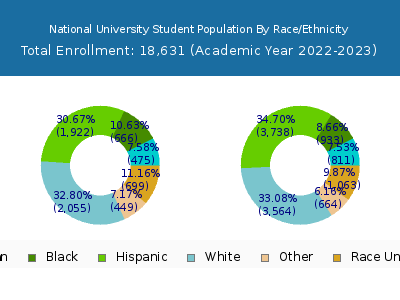
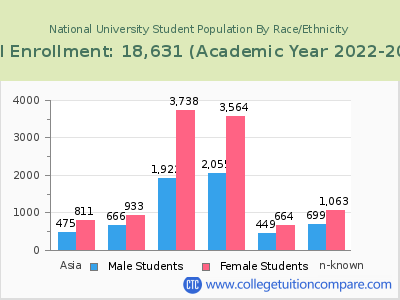
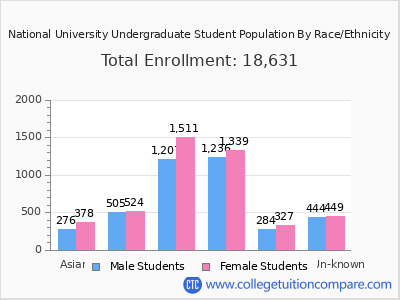
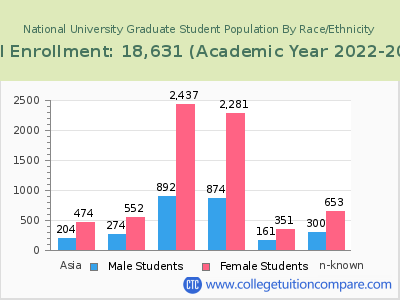
Student Distribution by Race/Ethnicity
| Race | Total | Men | Women |
|---|---|---|---|
| American Indian or Native American | 68 | 24 | 44 |
| Asian | 1,367 | 495 | 872 |
| Black | 1,992 | 863 | 1,129 |
| Hispanic | 6,414 | 2,169 | 4,245 |
| Native Hawaiian or Other Pacific Islanders | 147 | 65 | 82 |
| White | 5,793 | 2,115 | 3,678 |
| Two or more races | 968 | 381 | 587 |
| Race Unknown | 1,874 | 749 | 1,125 |
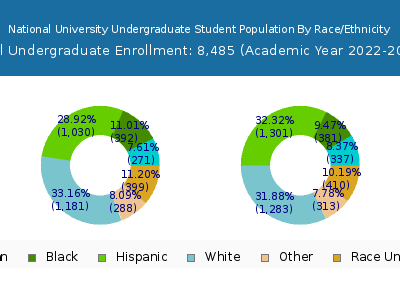
| Race | Total | Men | Women |
|---|---|---|---|
| American Indian or Native American | 41 | 19 | 22 |
| Asian | 654 | 276 | 378 |
| Black | 1,029 | 505 | 524 |
| Hispanic | 2,718 | 1,207 | 1,511 |
| Native Hawaiian or Other Pacific Islanders | 80 | 38 | 42 |
| White | 2,575 | 1,236 | 1,339 |
| Two or more races | 490 | 227 | 263 |
| Race Unknown | 893 | 444 | 449 |
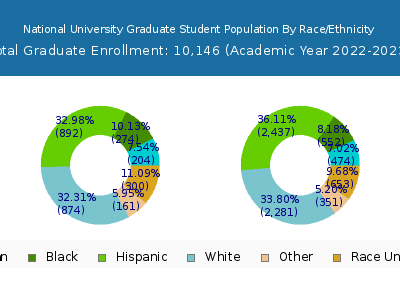
| Race | Total | Men | Women |
|---|---|---|---|
| American Indian or Native American | 6 | 2 | 4 |
| Asian | 105 | 53 | 52 |
| Black | 222 | 101 | 121 |
| Hispanic | 494 | 223 | 271 |
| Native Hawaiian or Other Pacific Islanders | 11 | 5 | 6 |
| White | 454 | 229 | 225 |
| Two or more races | 100 | 51 | 49 |
| Race Unknown | 175 | 88 | 87 |
Online Student Enrollment
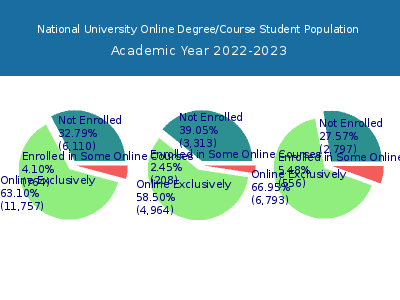
Distance learning, also called online education, is very attractive to students, especially who want to continue education and work in field. At National University, 11,757 students are enrolled exclusively in online courses and 764 students are enrolled in some online courses.
9,337 students lived in California or jurisdiction in which the school is located are enrolled exclusively in online courses and 2,420 students live in other State or outside of the United States.
| All Students | Enrolled Exclusively Online Courses | Enrolled in Some Online Courses | |
|---|---|---|---|
| All Students | 18,631 | 11,757 | 764 |
| Undergraduate | 8,485 | 4,964 | 208 |
| Graduate | 10,146 | 6,793 | 556 |
| California Residents | Other States in U.S. | Outside of U.S. | |
|---|---|---|---|
| All Students | 9,337 | 2,385 | 35 |
| Undergraduate | 3,564 | 1,383 | 17 |
| Graduate | 5,773 | 1,002 | 18 |
Transfer-in Students (Undergraduate)
Among 8,485 enrolled in undergraduate programs, 1,567 students have transferred-in from other institutions. The percentage of transfer-in students is 18.47%.474 students have transferred in as full-time status and 1,093 students transferred in as part-time status.
| Number of Students | |
|---|---|
| Regular Full-time | 3,879 |
| Transfer-in Full-time | 474 |
| Regular Part-time | 3,039 |
| Transfer-in Part-time | 1,093 |
