Student Population by Gender
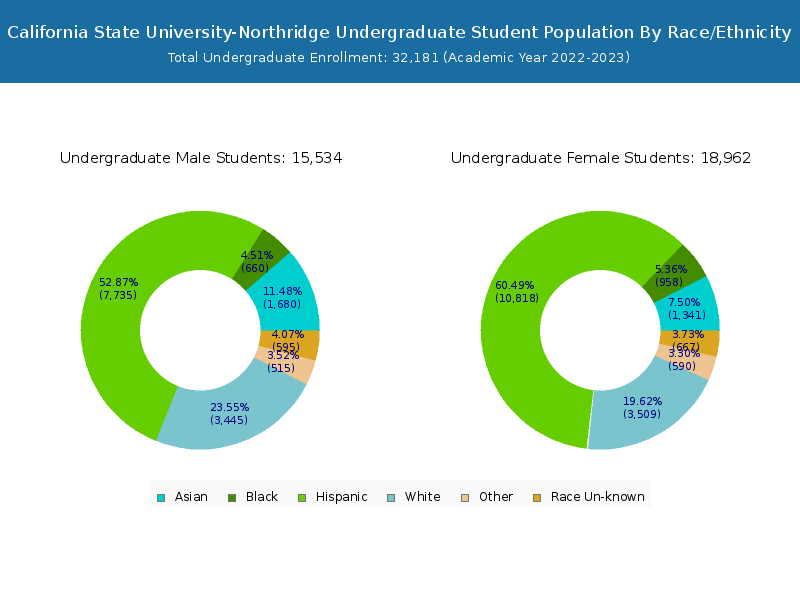
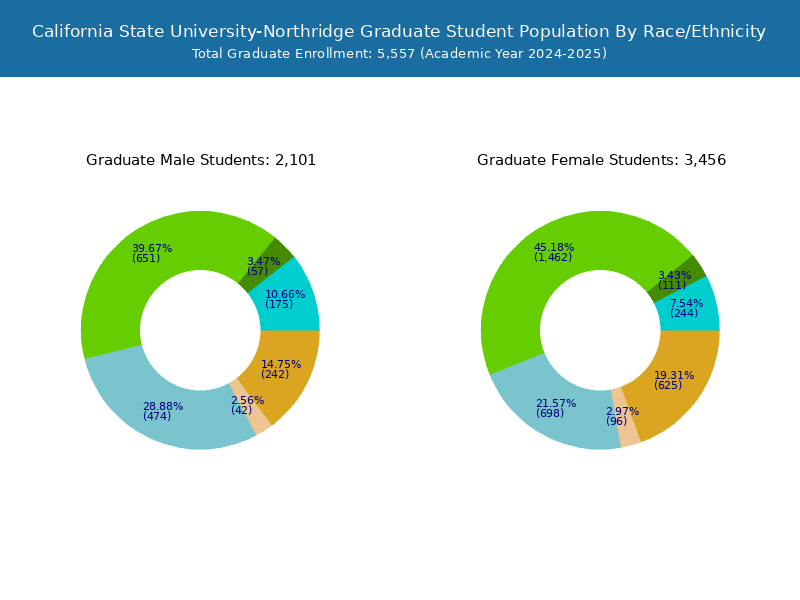
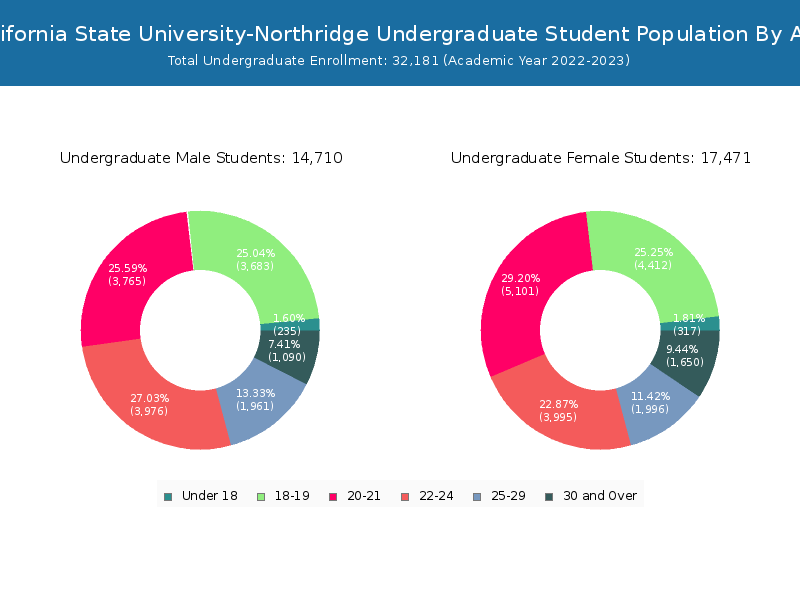
California State University-Northridge has a total of 37,579 enrolled students for the academic year 2022-2023. 32,181 students have enrolled in undergraduate programs and 5,398 students joined graduate programs.
By gender, 16,582 male and 20,997 female students (the male-female ratio is 44:56) are attending the school. The gender distribution is based on the 2022-2023 data.
| Total | Undergraduate | Graduate | |
|---|---|---|---|
| Total | 37,579 | 32,181 | 5,398 |
| Men | 16,582 | 14,710 | 1,872 |
| Women | 20,997 | 17,471 | 3,526 |
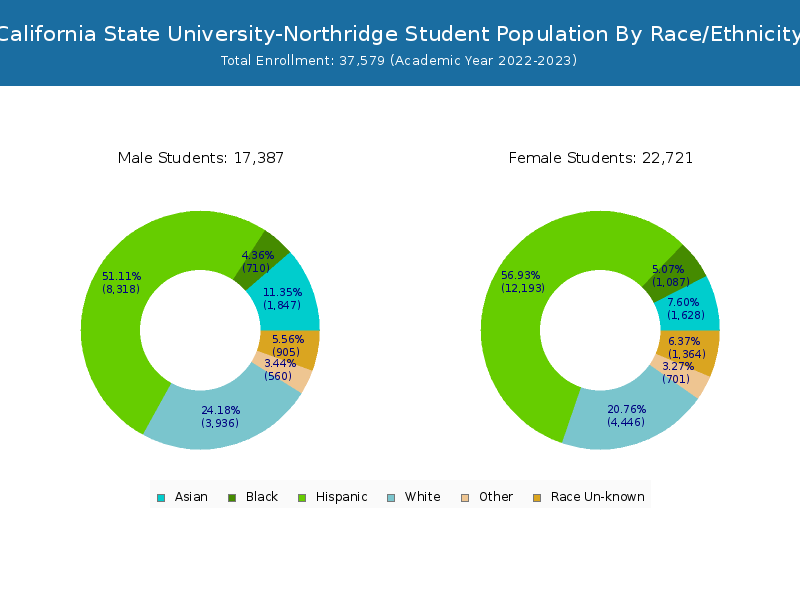
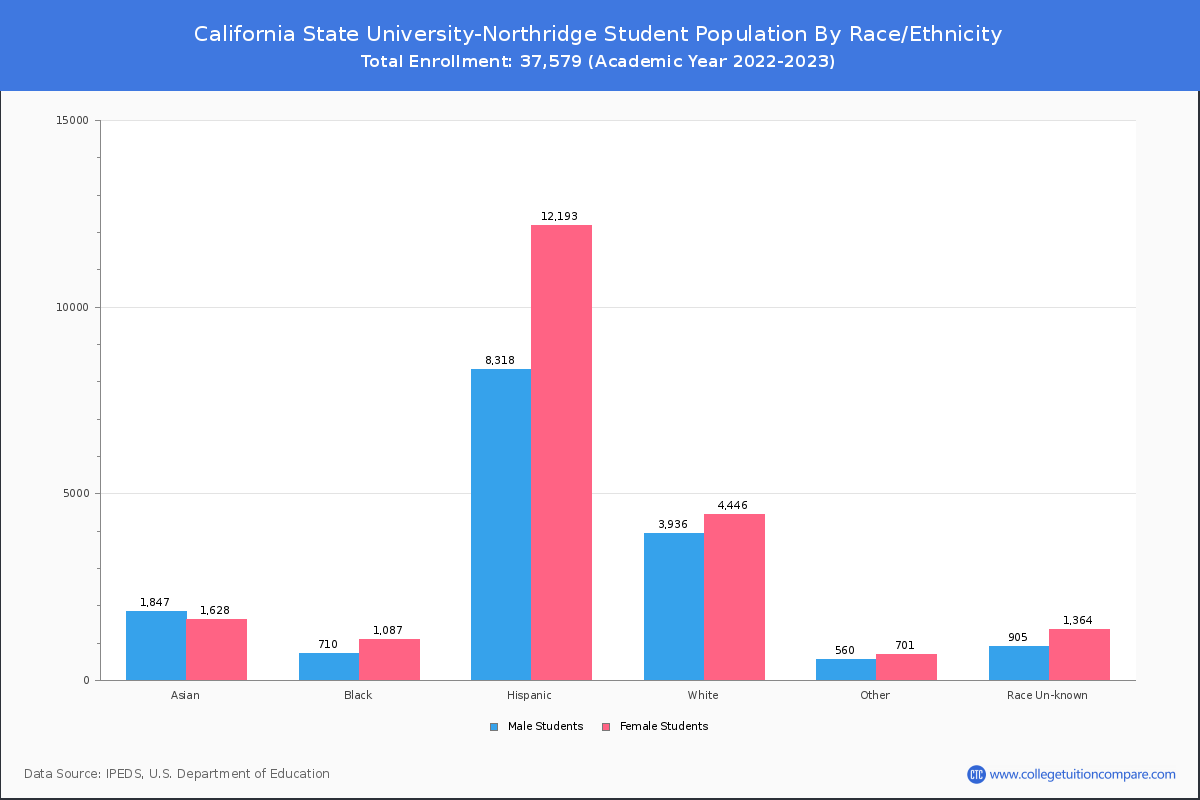
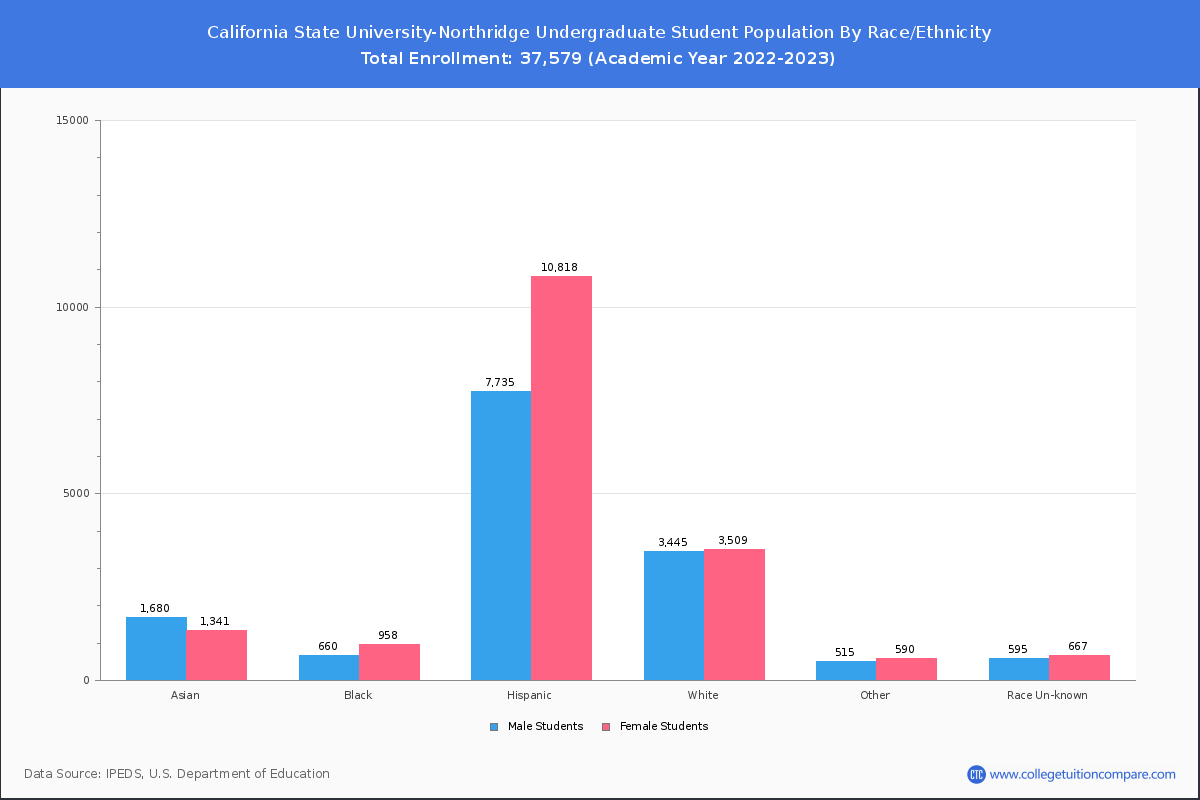
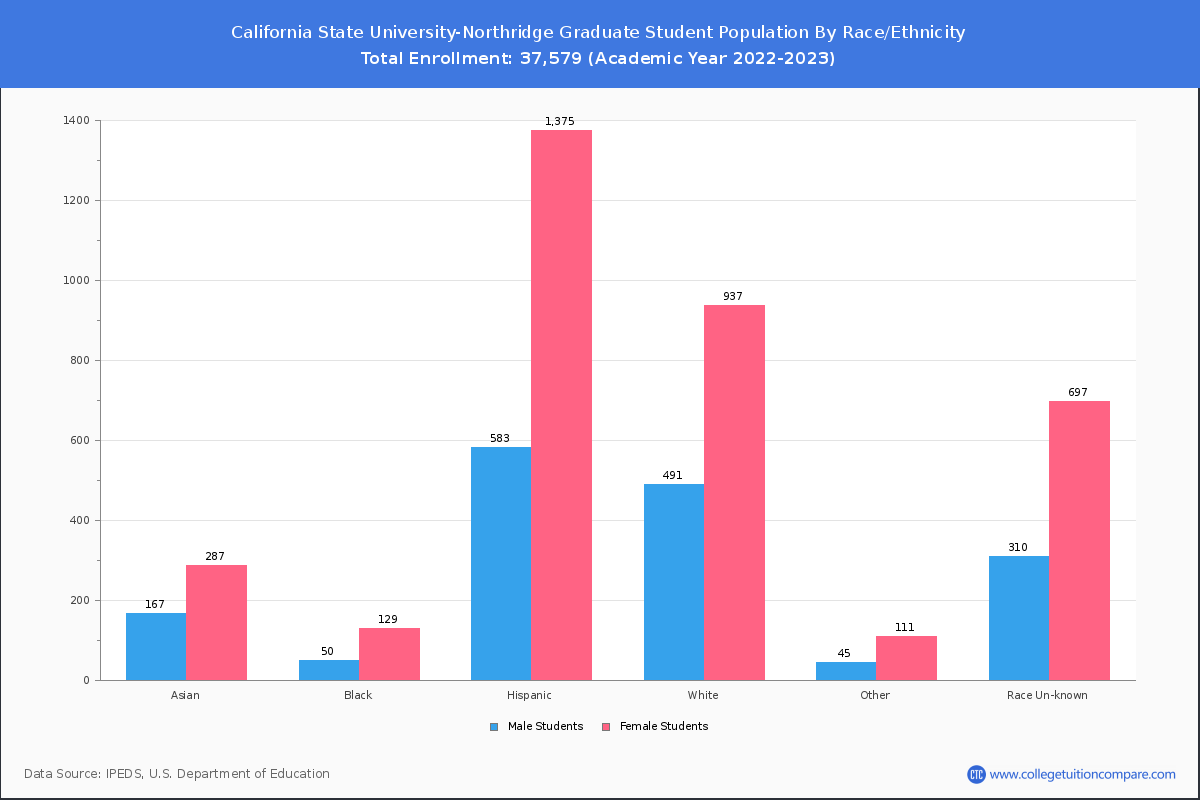
Student Distribution by Race/Ethnicity
By race/ethnicity, 7,535 White, 1,750 Black, and 3,344 Asian students out of a total of 37,579 are attending at California State University-Northridge. Comprehensive enrollment statistic data by race/ethnicity is shown in the next chart (Academic year 2022-2023 data).
| Race | Total | Men | Women |
|---|---|---|---|
| American Indian or Native American | 28 | 12 | 16 |
| Asian | 3,344 | 1,776 | 1,568 |
| Black | 1,750 | 705 | 1,045 |
| Hispanic | 20,107 | 8,281 | 11,826 |
| Native Hawaiian or Other Pacific Islanders | 52 | 25 | 27 |
| White | 7,535 | 3,599 | 3,936 |
| Two or more races | 1,110 | 509 | 601 |
| Race Unknown | 2,023 | 784 | 1,239 |
| Race | Total | Men | Women |
|---|---|---|---|
| American Indian or Native American | 20 | 10 | 10 |
| Asian | 2,937 | 1,616 | 1,321 |
| Black | 1,585 | 664 | 921 |
| Hispanic | 18,129 | 7,687 | 10,442 |
| Native Hawaiian or Other Pacific Islanders | 50 | 24 | 26 |
| White | 6,288 | 3,170 | 3,118 |
| Two or more races | 970 | 468 | 502 |
| Race Unknown | 1,124 | 527 | 597 |
| Race | Total | Men | Women |
|---|---|---|---|
| American Indian or Native American | 3 | 0 | 3 |
| Asian | 504 | 264 | 240 |
| Black | 224 | 93 | 131 |
| Hispanic | 2,413 | 996 | 1,417 |
| Native Hawaiian or Other Pacific Islanders | 7 | 2 | 5 |
| White | 1,369 | 657 | 712 |
| Two or more races | 161 | 70 | 91 |
| Race Unknown | 220 | 94 | 126 |
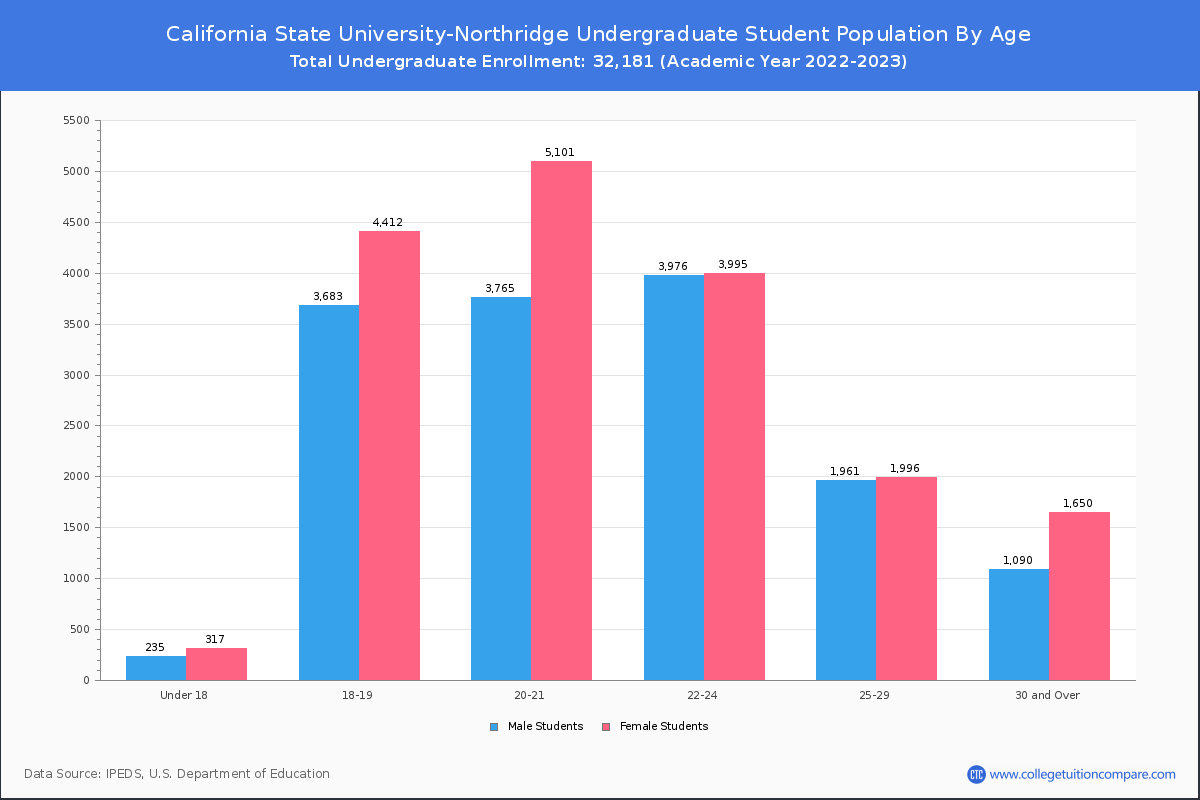
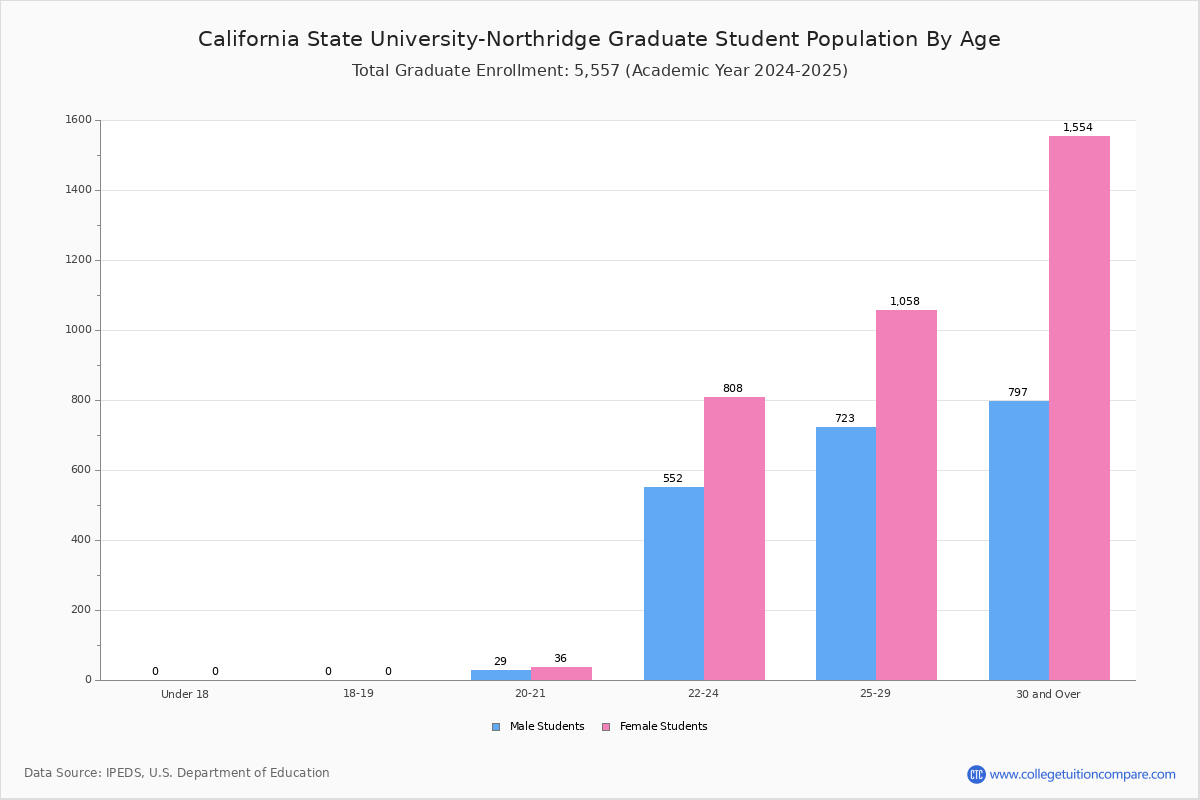
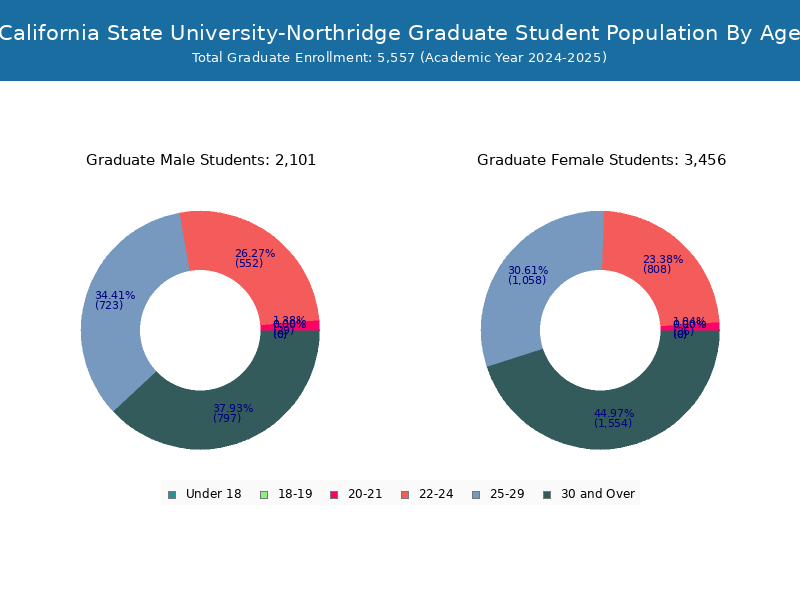
Student Age Distribution
By age, CSUN has 552 students under 18 years old and 43 students over 65 years old. There are 26,735 students under 25 years old, and 10,844 students over 25 years old out of 37,579 total students.
In undergraduate programs, 552 students are younger than 18 and 20 students are older than 65. CSUN has 25,484 undergraduate students aged under 25 and 6,697 students aged 25 and over.
It has 1,251 graduate students aged under 25 and 4,147 students aged 25 and over.
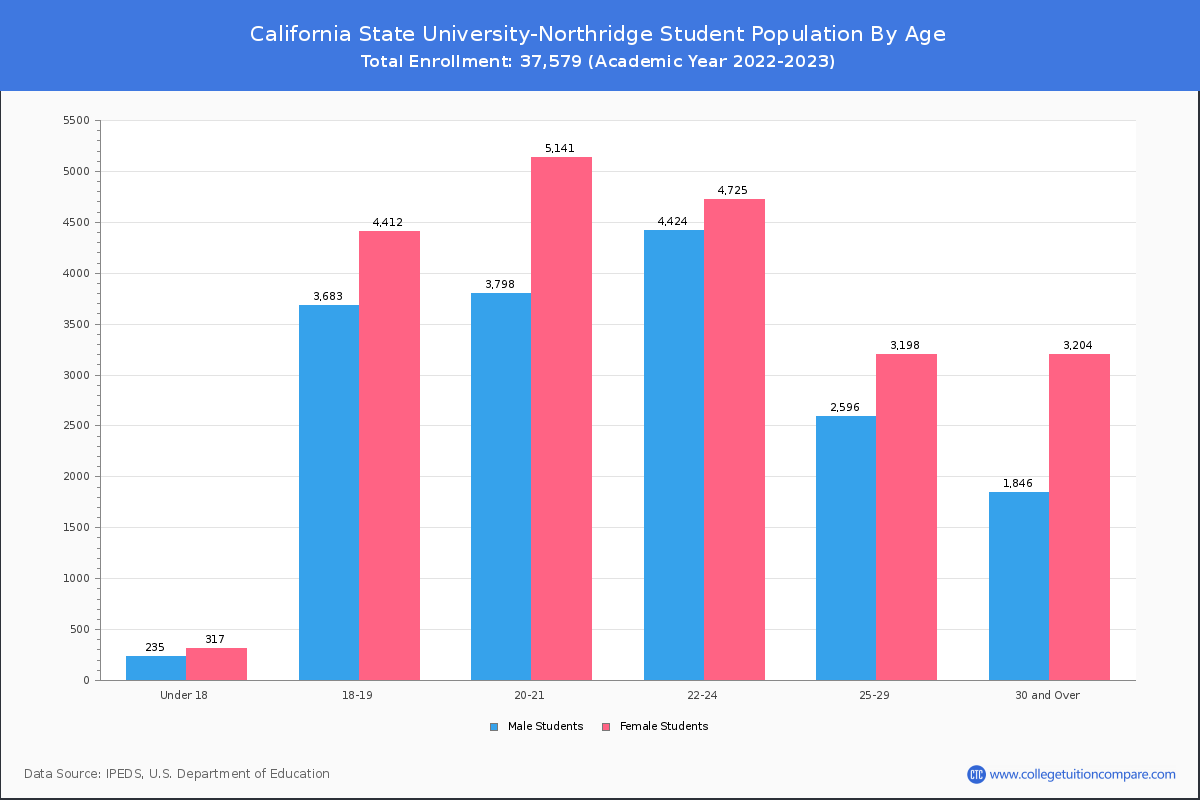
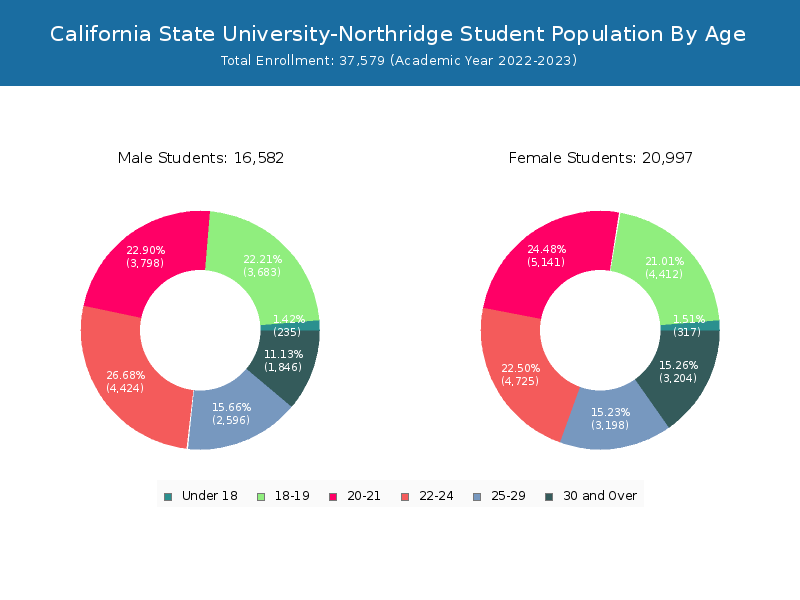
| Age | Total | Men | Women |
|---|---|---|---|
| Under 18 | 552 | 317 | 235 |
| 18-19 | 8,095 | 4,412 | 3,683 |
| 20-21 | 8,939 | 5,141 | 3,798 |
| 22-24 | 9,149 | 4,725 | 4,424 |
| 25-29 | 5,794 | 3,198 | 2,596 |
| 30-34 | 2,330 | 1,394 | 936 |
| 35-39 | 1,107 | 675 | 432 |
| 40-49 | 1,131 | 805 | 326 |
| 50-64 | 439 | 303 | 136 |
| Over 65 | 43 | 27 | 16 |
| Age | Total | Men | Women |
|---|---|---|---|
| Under 18 | 552 | 317 | 235 |
| 18-19 | 8,095 | 4,412 | 3,683 |
| 20-21 | 8,866 | 5,101 | 3,765 |
| 22-24 | 7,971 | 3,995 | 3,976 |
| 25-29 | 3,957 | 1,996 | 1,961 |
| 30-34 | 1,392 | 773 | 619 |
| 35-39 | 601 | 352 | 249 |
| 40-49 | 530 | 370 | 160 |
| 50-64 | 197 | 140 | 57 |
| Over 65 | 20 | 15 | 5 |
| Age | Total | Men | Women |
|---|
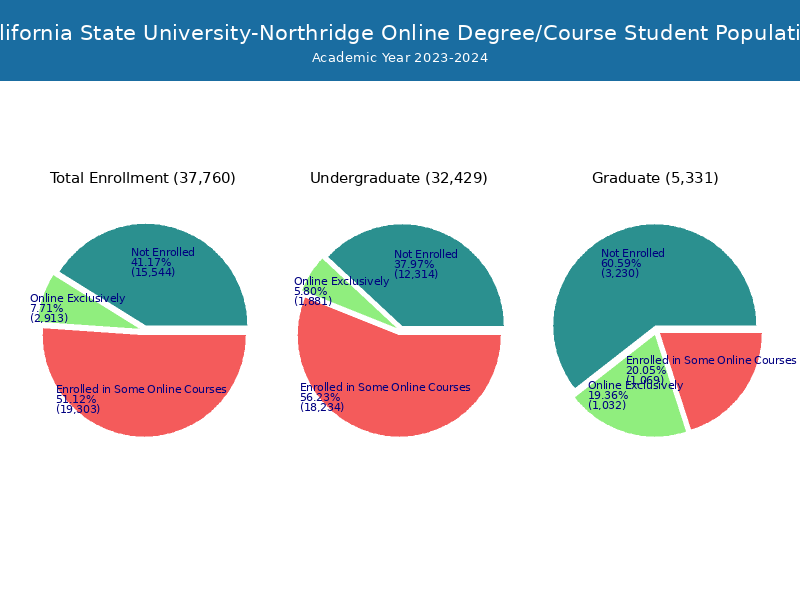
Online Student Enrollment
Distance learning, also called online education, is very attractive to students, especially who want to continue education and work in field. At California State University-Northridge, 3,333 students are enrolled exclusively in online courses and 18,503 students are enrolled in some online courses.
3,213 students lived in California or jurisdiction in which the school is located are enrolled exclusively in online courses and 120 students live in other State or outside of the United States.
| All Students | Enrolled Exclusively Online Courses | Enrolled in Some Online Courses | |
|---|---|---|---|
| All Students | 37,579 | 3,333 | 18,503 |
| Undergraduate | 32,181 | 2,123 | 17,387 |
| Graduate | 5,398 | 1,210 | 1,116 |
| California Residents | Other States in U.S. | Outside of U.S. | |
|---|---|---|---|
| All Students | 3,213 | 95 | 25 |
| Undergraduate | 2,088 | 17 | 18 |
| Graduate | 1,125 | 78 | 7 |
Transfer-in Students (Undergraduate)
Among 32,181 enrolled in undergraduate programs, 5,076 students have transferred-in from other institutions. The percentage of transfer-in students is 15.77%.3,910 students have transferred in as full-time status and 1,166 students transferred in as part-time status.
| Number of Students | |
|---|---|
| Regular Full-time | 22,278 |
| Transfer-in Full-time | 3,910 |
| Regular Part-time | 4,827 |
| Transfer-in Part-time | 1,166 |