Student Population by Gender
University of Arizona has a total of 49,403 enrolled students for the academic year 2022-2023. 38,751 students have enrolled in undergraduate programs and 10,652 students joined graduate programs.
By gender, 21,985 male and 27,418 female students (the male-female ratio is 45:55) are attending the school. The gender distribution is based on the 2022-2023 data.
| Total | Undergraduate | Graduate | |
|---|---|---|---|
| Total | 49,403 | 38,751 | 10,652 |
| Men | 21,985 | 17,213 | 4,772 |
| Women | 27,418 | 21,538 | 5,880 |
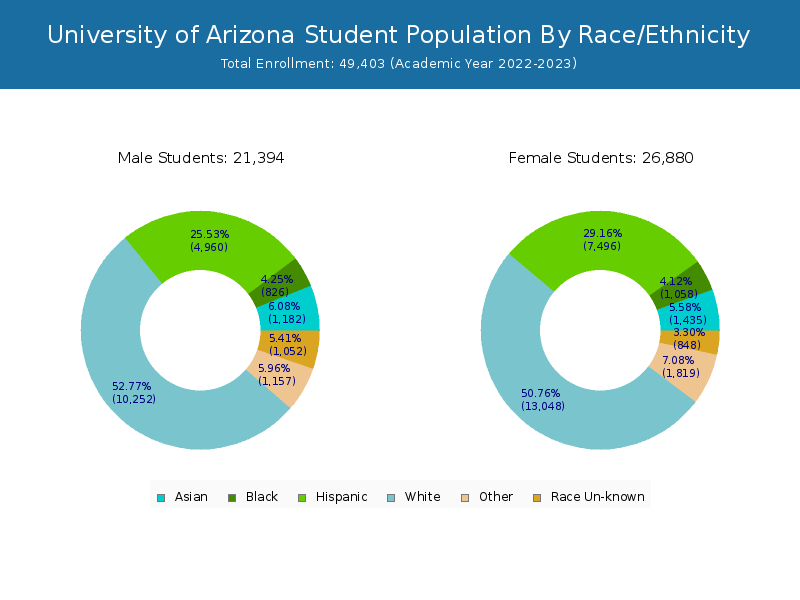
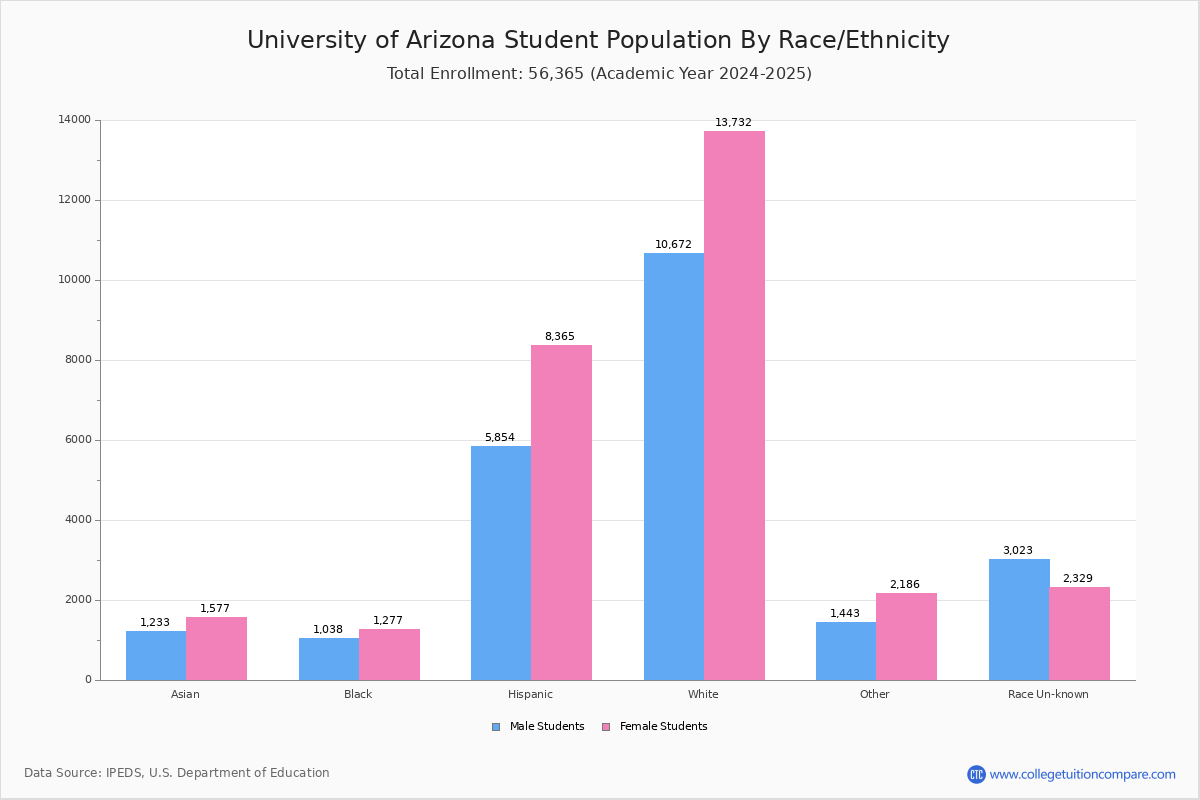
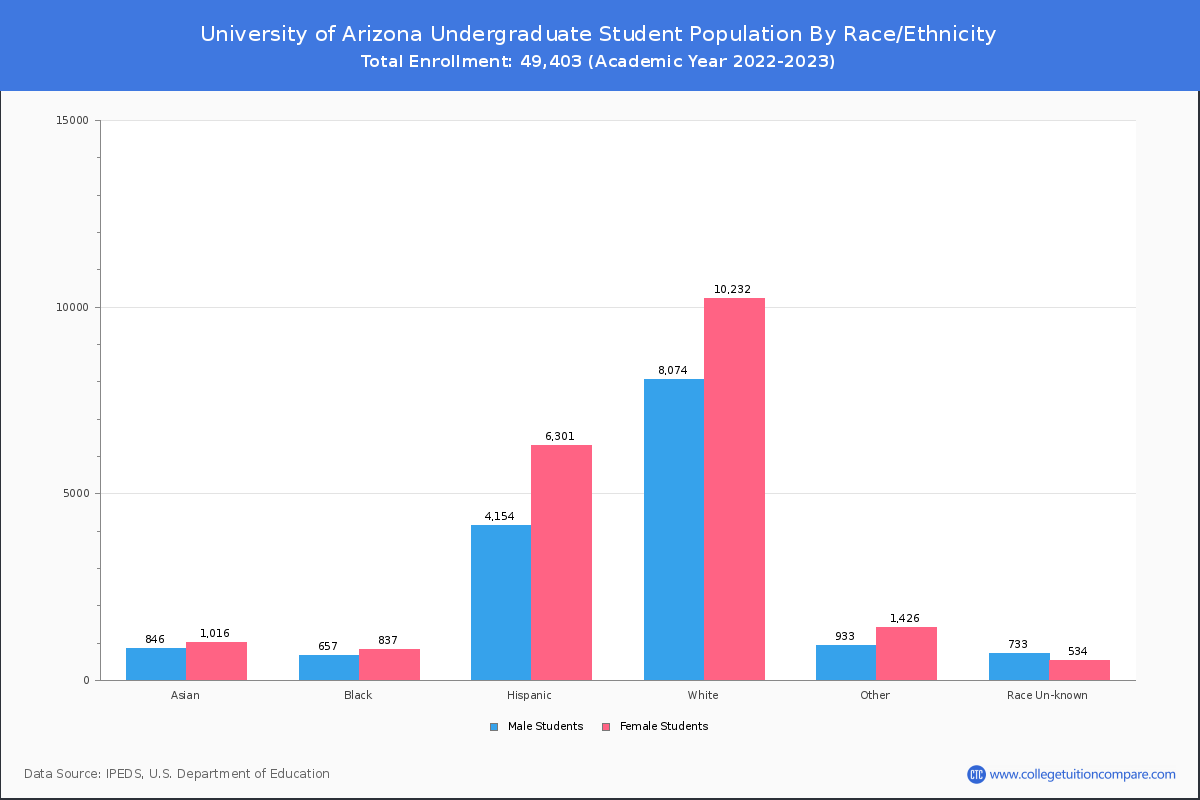
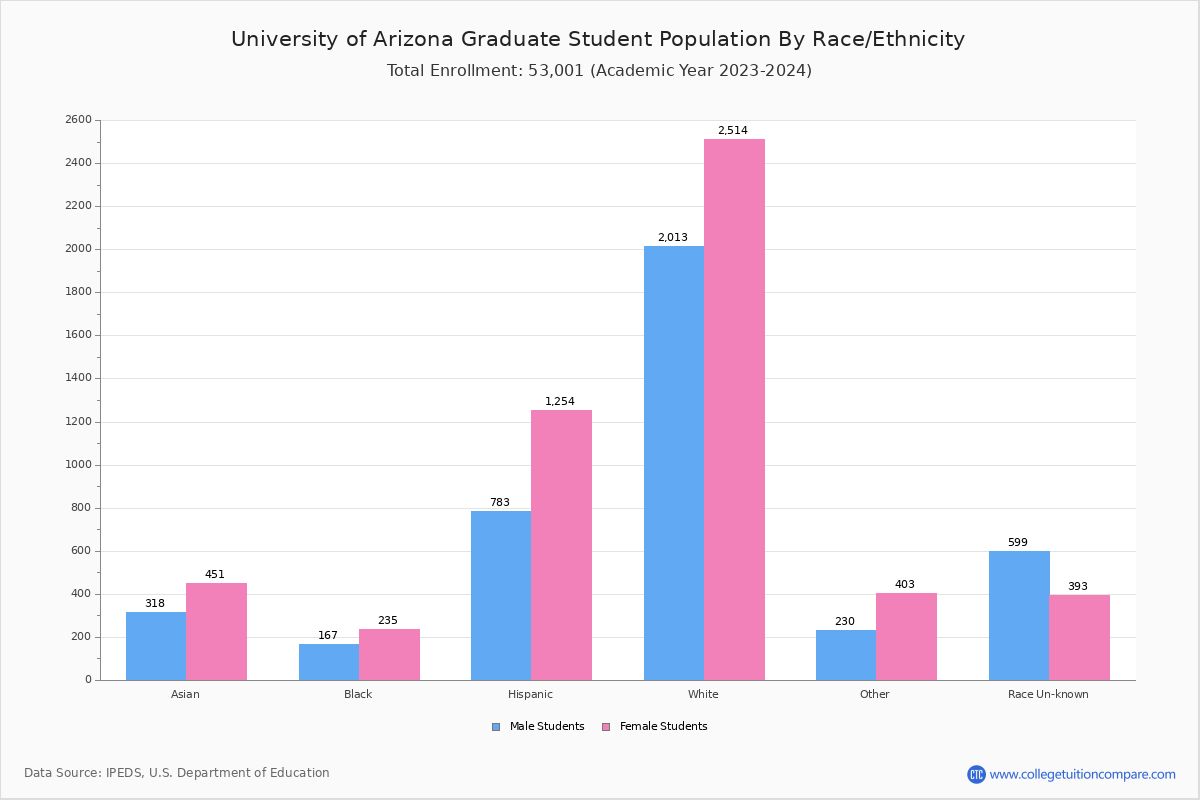
Student Distribution by Race/Ethnicity
By race/ethnicity, 23,632 White, 1,993 Black, and 2,804 Asian students out of a total of 49,403 are attending at University of Arizona. Comprehensive enrollment statistic data by race/ethnicity is shown in the next chart (Academic year 2022-2023 data).
| Race | Total | Men | Women |
|---|---|---|---|
| American Indian or Native American | 697 | 229 | 468 |
| Asian | 2,804 | 1,246 | 1,558 |
| Black | 1,993 | 906 | 1,087 |
| Hispanic | 12,683 | 5,142 | 7,541 |
| Native Hawaiian or Other Pacific Islanders | 93 | 43 | 50 |
| White | 23,632 | 10,372 | 13,260 |
| Two or more races | 2,341 | 957 | 1,384 |
| Race Unknown | 1,658 | 933 | 725 |
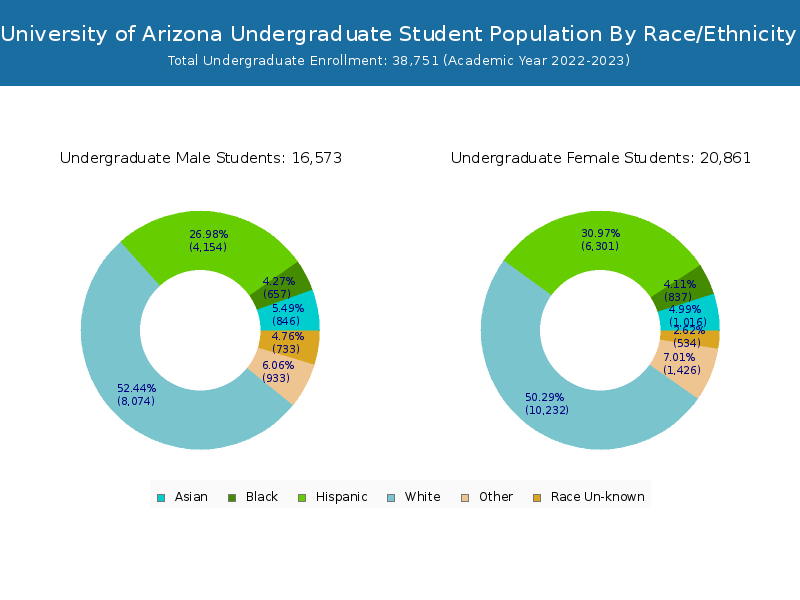
| Race | Total | Men | Women |
|---|---|---|---|
| American Indian or Native American | 496 | 173 | 323 |
| Asian | 2,034 | 933 | 1,101 |
| Black | 1,595 | 734 | 861 |
| Hispanic | 10,696 | 4,322 | 6,374 |
| Native Hawaiian or Other Pacific Islanders | 83 | 40 | 43 |
| White | 18,976 | 8,328 | 10,648 |
| Two or more races | 1,956 | 803 | 1,153 |
| Race Unknown | 1,014 | 591 | 423 |
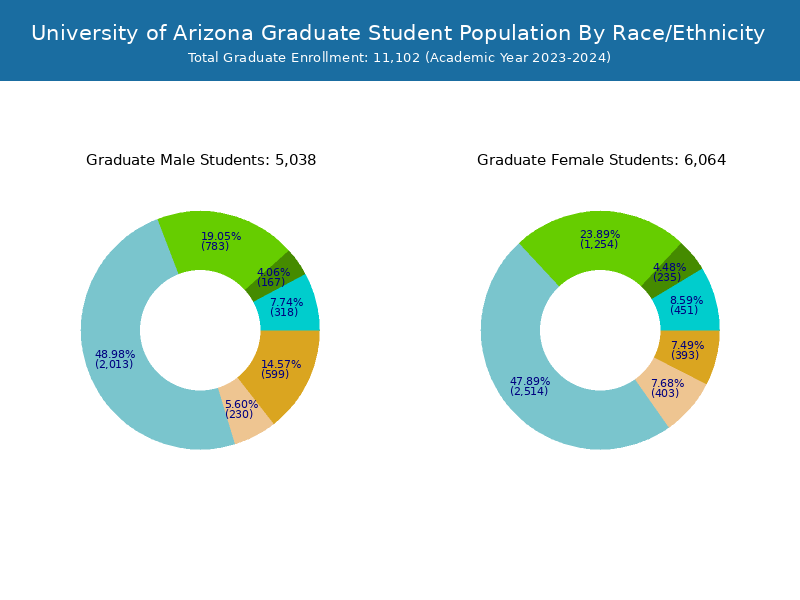
| Race | Total | Men | Women |
|---|---|---|---|
| American Indian or Native American | 81 | 30 | 51 |
| Asian | 111 | 48 | 63 |
| Black | 217 | 104 | 113 |
| Hispanic | 886 | 404 | 482 |
| Native Hawaiian or Other Pacific Islanders | 9 | 1 | 8 |
| White | 1,274 | 651 | 623 |
| Two or more races | 139 | 57 | 82 |
| Race Unknown | 69 | 39 | 30 |
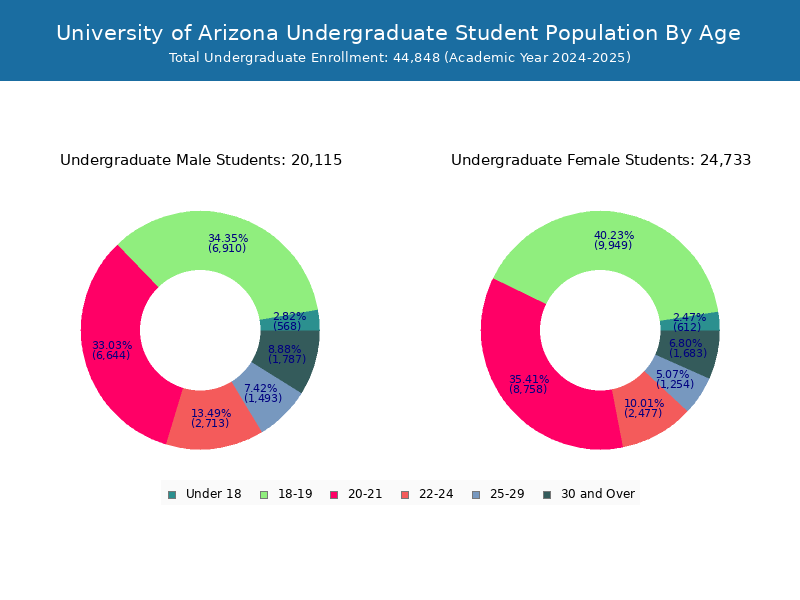
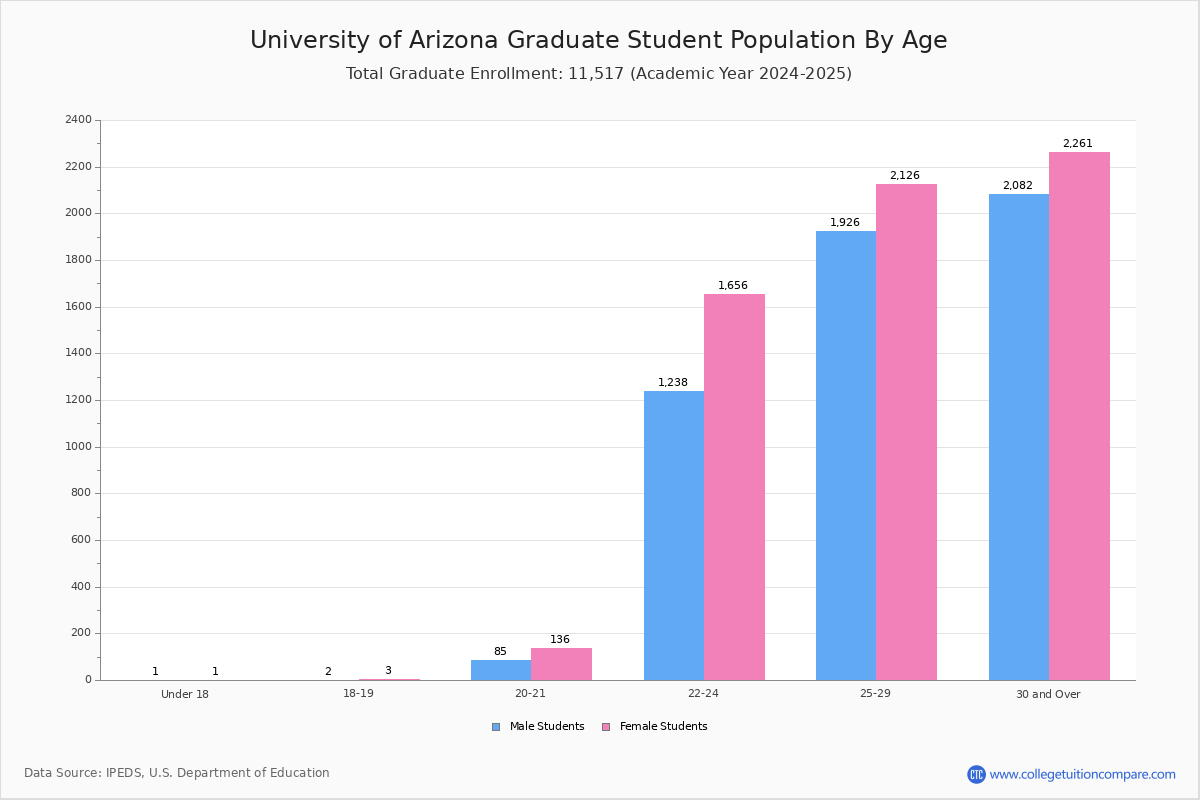
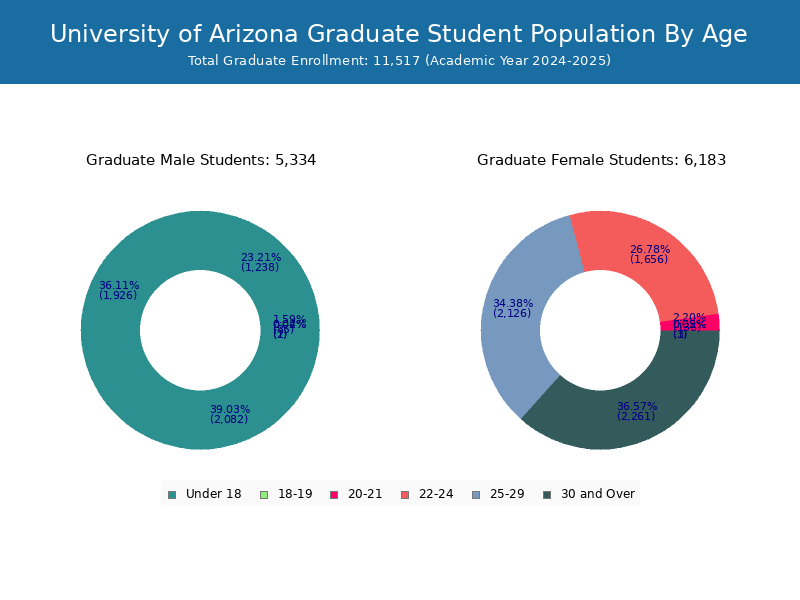
Student Age Distribution
By age, Arizona has 949 students under 18 years old and 56 students over 65 years old. There are 35,902 students under 25 years old, and 13,501 students over 25 years old out of 49,403 total students.
In undergraduate programs, 948 students are younger than 18 and 20 students are older than 65. Arizona has 33,266 undergraduate students aged under 25 and 5,485 students aged 25 and over.
In graduate schools at Arizona, 1 students are younger than 18 and 36 students are older than 65. It has 2,636 graduate students aged under 25 and 8,016 students aged 25 and over.
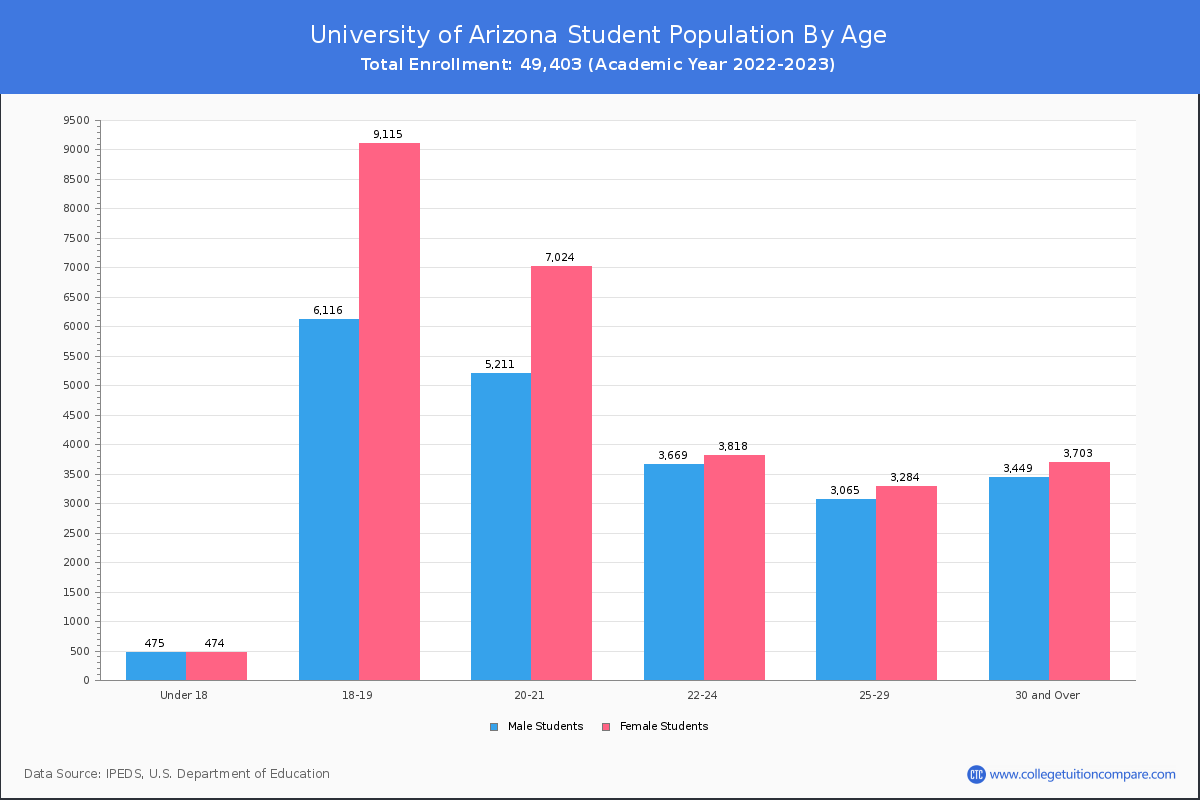
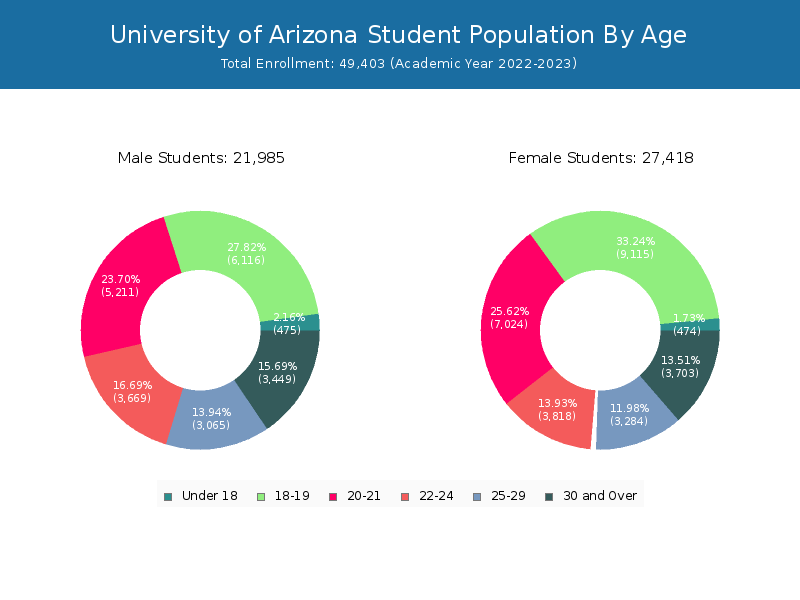

| Age | Total | Men | Women |
|---|---|---|---|
| Under 18 | 949 | 474 | 475 |
| 18-19 | 15,231 | 9,115 | 6,116 |
| 20-21 | 12,235 | 7,024 | 5,211 |
| 22-24 | 7,487 | 3,818 | 3,669 |
| 25-29 | 6,349 | 3,284 | 3,065 |
| 30-34 | 3,147 | 1,544 | 1,603 |
| 35-39 | 1,629 | 823 | 806 |
| 40-49 | 1,749 | 955 | 794 |
| 50-64 | 571 | 353 | 218 |
| Over 65 | 56 | 28 | 28 |
| Age | Total | Men | Women |
|---|---|---|---|
| Under 18 | 948 | 473 | 475 |
| 18-19 | 15,223 | 9,108 | 6,115 |
| 20-21 | 12,052 | 6,911 | 5,141 |
| 22-24 | 5,043 | 2,378 | 2,665 |
| 25-29 | 2,473 | 1,175 | 1,298 |
| 30-34 | 1,265 | 590 | 675 |
| 35-39 | 739 | 355 | 384 |
| 40-49 | 769 | 405 | 364 |
| 50-64 | 219 | 134 | 85 |
| Over 65 | 20 | 9 | 11 |
| Age | Total | Men | Women |
|---|---|---|---|
| Under 18 | 1 | 1 | 0 |
| 18-19 | 8 | 7 | 1 |
| 20-21 | 183 | 113 | 70 |
| 22-24 | 2,444 | 1,440 | 1,004 |
| 25-29 | 3,876 | 2,109 | 1,767 |
| 30-34 | 1,882 | 954 | 928 |
| 35-39 | 890 | 468 | 422 |
| 40-49 | 980 | 550 | 430 |
| 50-64 | 352 | 219 | 133 |
| Over 65 | 36 | 19 | 17 |
Online Student Enrollment
Distance learning, also called online education, is very attractive to students, especially who want to continue education and work in field. At University of Arizona, 9,617 students are enrolled exclusively in online courses and 19,965 students are enrolled in some online courses.
4,101 students lived in Arizona or jurisdiction in which the school is located are enrolled exclusively in online courses and 5,516 students live in other State or outside of the United States.
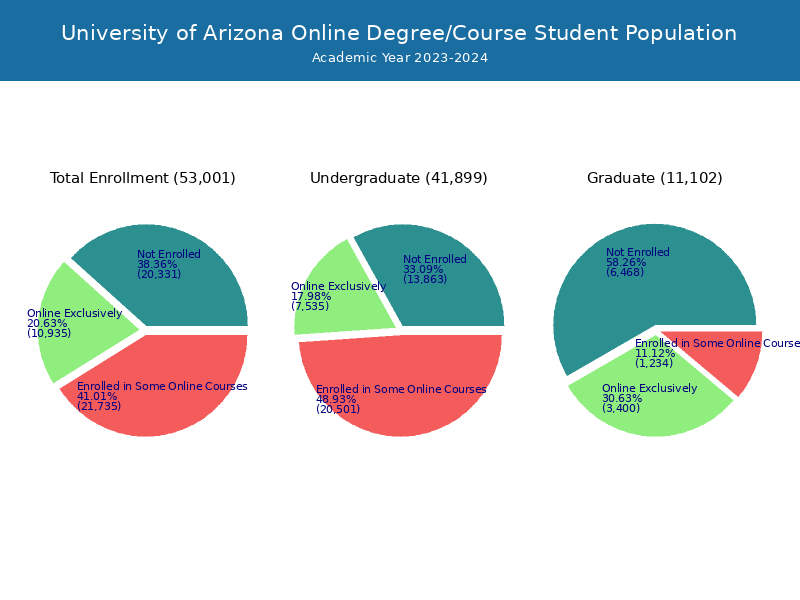
| All Students | Enrolled Exclusively Online Courses | Enrolled in Some Online Courses | |
|---|---|---|---|
| All Students | 49,403 | 9,617 | 19,965 |
| Undergraduate | 38,751 | 6,616 | 18,688 |
| Graduate | 10,652 | 3,001 | 1,277 |
| Arizona Residents | Other States in U.S. | Outside of U.S. | |
|---|---|---|---|
| All Students | 4,101 | 5,222 | 294 |
| Undergraduate | 2,616 | 3,825 | 175 |
| Graduate | 1,485 | 1,397 | 119 |
Transfer-in Students (Undergraduate)
Among 38,751 enrolled in undergraduate programs, 2,848 students have transferred-in from other institutions. The percentage of transfer-in students is 7.35%.1,739 students have transferred in as full-time status and 1,109 students transferred in as part-time status.
| Number of Students | |
|---|---|
| Regular Full-time | 28,491 |
| Transfer-in Full-time | 1,739 |
| Regular Part-time | 7,412 |
| Transfer-in Part-time | 1,109 |